Subscribe to AGB - One analysis of a good business in each issue.
Lululemon
“So, the product innovation that I've been sharing with you really is underpinned by really one of the most important facets of our work, and that is our raw materials. Raw materials sit at the heart of how we enable our guests to feel and perform their best. There is a science to why Align pants feel like butter and our Fast and Free feel cool to the touch. We apply years and years of rigorous testing and worked with our partners globally to be able to deliver and unlock new sensations to our guests through fabric innovation to solve their unmet needs. We're constantly innovating new ways to enhance the guest experience by iterating our current raw materials, creating new ones.” – Former Chief Product Officer, Sun Choe, at Lululemon’s 2022 Analyst Day
Lululemon is a leading designer and retailer of athleisure and sports apparel. The company’s first store was opened in 1998 in Vancouver, Canada. With the initial success of its Luon fabric for its women’s yoga leggings and the company’s subsequent product and fabric innovations, Lululemon has grown into a global brand. As of 2023, the company had 758 store locations (the main geographies are U.S., China, Canada, Australia and the U.K.) and generated $9.6B in revenues servicing over 20M members.
Lululemon’s initial core product was women’s yoga apparel. There were a few reasons for the company’s early success. First, women’s yoga apparel was a market that was under-served, especially for products made with innovative fabrics. The Luon fabric was important in that it was breathable and soft yet supportive. And while price points were high, the quality and innovation on the fabric side allowed for the company to successfully position its products in the premium tier.
Second, Lululemon was smart to leverage community based marketing tactics to popularize the brand and its products within local markets. Customers were offered yoga and other fitness classes in its stores to get an introduction to the brand. Later Lululemon introduced its brand ambassador program, in which the company partnered with local fitness instructors to help promote the brand in exchange for small perks like early access to new products, a contributing voice in product direction and a yearly allotment of free products. Today, the company has over 2k brand ambassadors, 50 of which are global ambassadors. Lululemon also sponsors community events like 5k and 10k races.
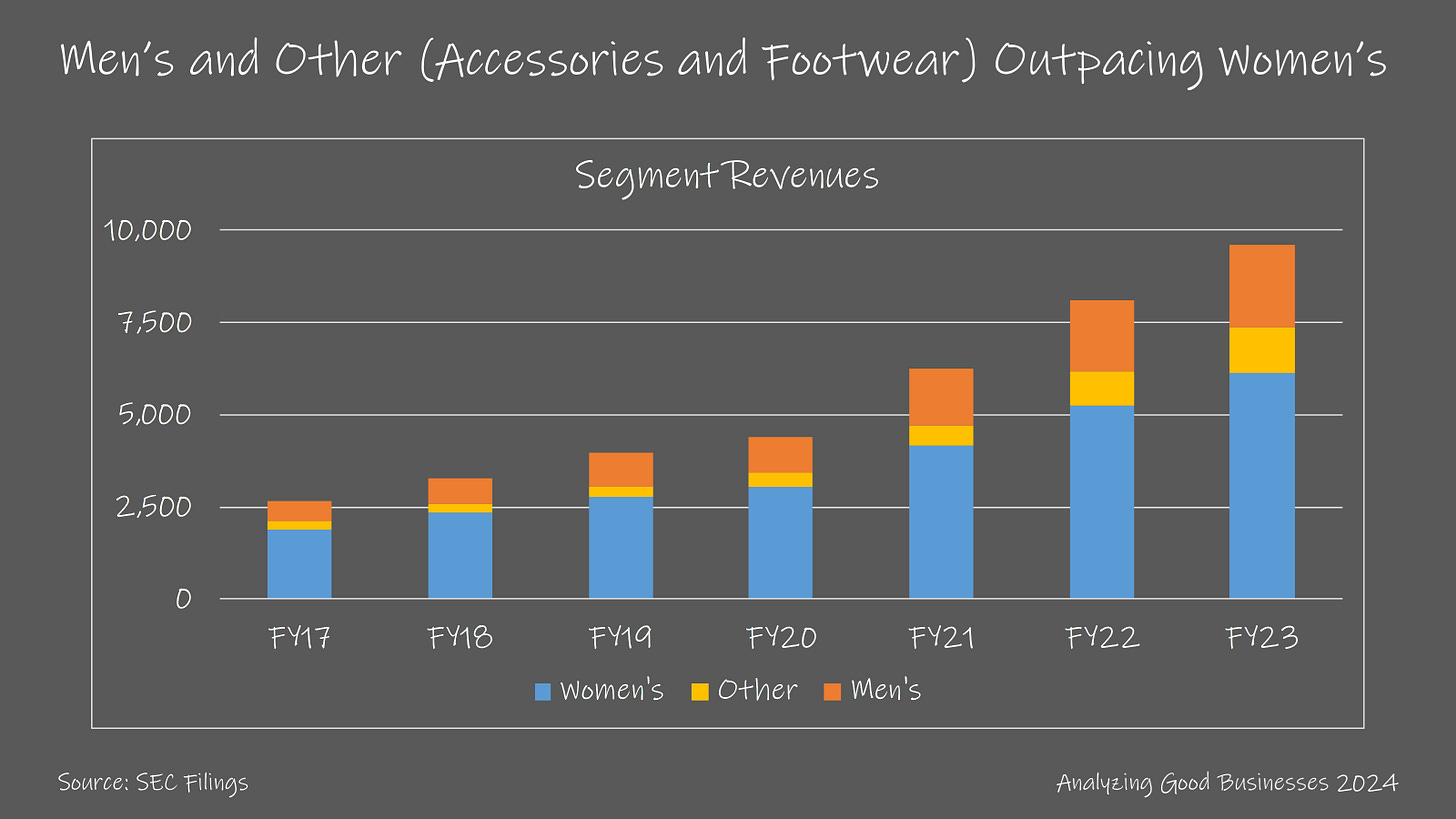
As the brand grew, Lululemon expanded its product line-up to include men’s and accessories. Since the company started disclosing the breakdown between segments in 2017, the men’s segment has outpaced the women’s segment at a 27.4% vs. 21.7% CAGR. Women’s is now a $6B segment, while men’s is over $2.2B. Lululemon also expanded to offer apparel targeting other fitness hobbies like running, golf, tennis and weight training.
The company has continued to innovate on fabrics, some of which are used for specific collections under Lululemon brand. Women’s has the sub-brands of Align ($1B franchise as of 2022), Scuba, Define, and Softstreme and men’s has the ABC collection and License to Train. Some of Lululemon’s newer fabric innovations include:
Everlux, which is meant for hot exercise environments,
Nulu, which is essentially a lighter version of Luon,
Nulux, which are similar to Nulu but for high sweat exercises, and
Silverscent, which helps neutralize odor by combating bacteria.
Similar to other apparel retailers, Lululemon designs its products and contracts out the manufacturing to third parties, mostly located in Asia. This allows the company to be more capital light, benefit on margins, and have flexibility on ramping up and down production. This doesn’t come without risks. The three main risks are that the company is less in control of its supply that could lead inventory stock outs, subject to varying levels of quality in materials and have the potential for knockoffs.
Once the company secures the products from its manufacturing partners, Lululemon distributes its products through its own network of physical stores and its eCommerce business. The stores are important because they provide the connection with the fitness community and brand ambassadors in a local region. They also facilitate many of the omnichannel features offered to customers like buy online/pick up in store, return in store, ship to store, etc.
Lululemon heavily invests in its distribution network and was able to take full advantage of the pull-forward of eCommerce from off-line shopping during the Covid pandemic. The company’s revenues from its eCommerce business surpassed its stores in 2022 and they each commanded more than $4B of revenues in 2023. The eCommerce business was only introduced in 2009, accounting for just 4% of revenues that year. Operating margins for the eCommerce business is also much higher at 42% in 2023 vs. 27% for the stores.
The company once also had a kid’s line of products under the ivivva brand that was launched in 2009. It was mostly dance-inspired apparel for girls. Lululemon even built out individual stores for this sub-brand, reaching 55 locations within the U.S. and Canada by 2016. The stores weren’t as productive as the core Lululemon stores, almost reaching $1,000/sq ft (as compared to $1,600/sq ft). The company closed almost all of these stores by 2017.
Lululemon gave updated 5 year growth and margin targets at its 2022 analyst day. The company exceeded the prior 5 year target given at its 2019 analyst day, even including the impact from Covid. The latest growth targets call for a doubling of revenues by 2027, from (1) low double digit % growth in women’s and a 2x in men’s, (2) low double digit % growth in the core North America region and a 4x in international, or (3) a mid teens growth in stores and a 2x in eCommerce.
Why is it a good business?
As one of the leading athleisure companies, Lululemon benefits from its intangible assets. The company’s brand is highly associated with quality yoga apparel. Leaning on the brand’s association with quality and innovative fabrics, the company has been able to expand into adjacent categories like men’s and accessories. The brand signals to new and existing customers that these newer product extensions also come with a similar level of quality and innovation. This leads to lower customer acquisition cost for new customers and higher retention rates for existing customers. Lululemon’s highest value guests (top 20% of spenders) have a 92% retention rate.
As the company has grown, Lululemon has also started to experience scale advantages. There are the usual benefits like power over suppliers, sourcing of materials and increasing advertising efficiency. One of the more overlooked benefits is the ability to efficiently vertically integrate. Lululemon sells almost exclusively through its own channels via its stores and eCommerce business. This way, the company can control its pricing (and discounting) and better manage its inventories and product assortment. This also loops back with the the brands association as a premium product, since the company has full control over discounting.
For a company of its size, Lululemon’s eCommerce business contributes to a larger portion of its total revenues and offers most features that you’d see with large omnichannel retailers. Customers can buy online pick up in store, access inventory at other locations, have items shipped to the home or a store, ship from the store, amd return in store because the company operates under a one inventory pool model.
The main benefit to Lululemon with the eCommerce business growing faster than the stores is the uplift in operating margins. One of the reasons for the higher margins is that the company experiences lower return rates than other retailers. This reduces the cost of shipping back to the company. And offering omnichannel capabilities like buy online/return in store and buy online/pick up in store also help. Another feature of the eCommerce business is that (1) it sees an uplift in sales when new stores are opened in a region (showing the power of an omnichannel retail model), and (2) it helps the company determine potential regions for new store openings.
The company has also just recently started to benefit from its membership program. Lululemon officially launched the Essentials membership program in 2022. With the free membership, customers have early access to the products, exchange or credit on sale items, and access to community events. The company reached 9M membership in the first 5 months of launch and saw a lift in spend of 9% for members. As of the first quarter of 2024, the program has 20M members. Lululemon has stated that it intends to convert 80% of customers to members over time.
At launch there was a premium tier version of the membership called Lululemon Studio, which was basically a monthly subscription for Mirror users at $39/month. (We’ll discuss the Mirror acquisition in more detail in the next section). That was downgraded to $13/month in early 2023 to offer the classes in digital app form, so customers wouldn’t need to purchase the Mirror hardware. That program then merged with the company’s partnership offering with Peloton.
Returns on incremental capital?
Over the past 10 years, Lululemon has spent 87% of its capital on capex and 13% on M&A. While the company doesn’t specifically disclose its R&D expenditures, it’s an important use of capital given Lululemon’s focus on product and fabric innovation. At its 2022 analyst day, the company disclosed that there are roughly 100 employees in the product development organization, 50 of which are focused on innovation.
Capex is related to opening new stores, remodeling or relocating existing stores, and investments in distribution and technology. Capex as a percentage of revenues has historically ranged between 6%-8%, except for 2020 when store related capex was reduced. The company’s current guidance for capex is 7%-9% of revenues from its Power of Three x2 target given at its 2022 analyst day. Lululemon doesn’t own or operate any manufacturing facilities, and similar to most others in the industry, outsource this to suppliers in Asia (Vietnam, Cambodia, Sri Lanka, Indonesia and Bangladesh). The company has relationships with 67 suppliers.
Lululemon’s stores are one of the most productive in all of retail at over $1,600/sq ft. While we typically like to breakdown retailers down to the unit economics of its stores, it’s quite difficult to do that with Lululemon for two reasons. First, the company’s eCommerce business makes up half of its revenues and the performance of the eCommerce business and the stores are highly intertwined. As mentioned earlier, eCommerce gets an uplift from new store openings in the region and the locations of new store openings are influenced by the performance of the eCommerce business.
And second, international is a much larger contributor to revenues now and these newer international locations don’t generate as much in revenue or command the same margins. From the revenue breakdown by geography, we know that the revenue/store (including eCommerce) from the Americas is more than double that of China or ROW. In 2023, these numbers were $17.4M/store in the Americas vs. $7.6M/store in China and $7M/store in ROW. And operating margins in the Americas are 38% vs. 35% in China and 20% in ROW.
Using company averages, stores generated about $4.8M-$5M in annual revenues pre-Covid and $5.3M-$5.8M in the past 2 years. Store operating margins are around 25%-27%. We also know that stores take 2-4 years to mature. So if you can make some assumptions about the costs to buildout stores, which varies by region, type and size of store, it’s likely that the returns are fairly high.
With respect to distribution investments, it’s likely that these capital expenditures generate high ROIs given the success of the eCommerce business, the importance of omnichannel offerings for customers and the improvements in gross margins. From 2015 to 2018, there was a 680bps improvement in gross margin from better sourcing and supply chain improvements. There were modest improvements from 2018 to 2022 due to volume increases and distribution network improvements and a jump in 2023 due to improving freight costs.
With respect to M&A, the company doesn’t really have a history of acquiring other companies, aside from Mirror in 2020. Back when Covid related lockdowns were in full swing, Lululemon acquired Mirror for $500M to ride the wave of in-home fitness. Looking back, most were positive on the potential of the combination, with Mirror being able to benefit from Lululemon’s distribution advantage. The most fitting comparison was Peloton, which was seeing its membership grow rapidly. Mirror generated $170M in revenues in 2020.
What was overlooked was that in-home fitness would likely revert back to normal levels in subsequent years and the price of the equipment being very high. The mirror itself costs $1495 and installation was another $250. The company started 2021 expecting Mirror to generate $250M-$275M for the year. Just two quarters later, the company adjusted revenue guidance to $125M-$130M, more than a 51% reduction. Then in 2022, the company launched the Studio app, which didn’t require the Mirror hardware. The company stopped selling the hardware altogether in the middle of 2023, and took impairment charges in 2022 and 2023.
We estimate that Lululemon generated returns on incremental capital between 45%-55% over the past 5 years. With the company’s disclosures of operating income and capex by store vs. eCommerce, I tried to estimate the incremental returns of each segment, however, the resulting ROIIC for the eCommerce were just too high. This again shows that the eCommerce and store segments are very much intertwined. On Mirror, even though the acquisition didn’t turn out to be the big winner than may thought it would become, because the acquisition price was only $500M, it didn’t have a meaningful impact to future returns.
Reinvestment potential?
According to the company’s estimate at its analyst day in 2022, the global sports apparel market was $115B, of which $83B is in North America. This would imply using 2022 financials, that Lululemon commanded 6%-7% of the market. The company’s expansion into other product categories like accessories, shoes, etc. increases the addressable market to $630B.
Lululemon has two main growth vectors going forward, international expansion and increasing brand awareness. In 2014, the company generated 6% of its revenues outside of North America. This compares to over 21% in 2023. China has been the highest growth region, increasing from 6 stores in 2016 (first year opened) to 127 stores in 2023. China is now the region with the highest number of stores outside of the U.S. at 367. The stores are predominantly located in tier 1 and tier 2 cities, split roughly 50/50. The target for 2026 in China is 220 stores.
The growth strategy in China is similar to that of other regions. Lululemon relies on 500 local ambassadors to promote the brand. And because it’s retail in China, the company leverages Tmall and JD.com as well as social commerce (including live stream commerce) and its own website. Even with the platform fees, operating margins in China are similar to that in the Americas with the eCommerce business exhibiting better operating margins than stores.
Increasing brand awareness is the other main opportunity. At its 2022 analyst day, the company stated that the brand only has 25% brand awareness in the U.S. (38% women’s and 11% men’s). And in China, brand awareness was only 7%. This compares to other long established fitness brands like Nike/Adidas with 80+%. And even by product category, there are opportunities to improve awareness. Lululemon is known for yoga and had 68% brand awareness in this category, followed by train at 49% and run at 43%.
The company is investing in brand campaigns to improve awareness. Larger retailers benefit from higher efficiency in national advertising (read our write-ups on Five Below, Tractor Supply, Casey’s General Stores, Ulta Beauty, O’Reilly Automotive). In 2022, Lululemon launched its Feel campaign, which resulted in increased awareness by 10.8%. It worked well to improve awareness in men with a 19% uplift in key U.S. cities. By the end of 2023, brand awareness improved to 31% in the U.S. and 14% in China.
With a reinvestment rate between 25%-35% and a return on incremental capital between 45%-55%, we estimate that Lululemon has increased its intrinsic value between 13%-16% over the past 5 years. There were slowdowns in the stores segment during Covid, but that was more than offset by the growth in eCommerce. Given the success during that period and maintaining high growth in the subsequent years of 2021-2023, the eCommerce business has outperformed expectations. Looking ahead, some of that growth should taper off, especially in the U.S. and we should expect to see more normalized growth and ROIIC in future years.
What else is important?
What to make of the recent slowdown in the U.S.?
Sometimes what’s overlooked is that Lululemon benefited from two strong tailwinds during Covid and yet the hangover from those tailwinds reversing is only showing up now. The first tailwind was the shift from services to goods, which was mostly transacted via eCommerce. Lululemon, like other companies that over-indexed (relative to their industry) to eCommerce gained market share. The company’s market share of the North American sports apparel industry increased from 3.6% in 2019 to 6.5% by 2023. We have to remember that Lululemon already had its eCommerce infrastructure in place prior to the pandemic while many other apparel companies were playing catch-up.
The second tailwind was the work from home phenomenon, which allowed people to dress more casually throughout the work week. This along with fitness at home, meant that athleisure and sports apparel would grow relative to other forms of apparel. While work from home is still a meaningful portion of the working population, a reversion to in-person work and fitness outside of the home is a headwind for Lululemon.
Since the fourth quarter of 2023, the company has seen its comp store sales growth slowdown in the U.S. Some of that is explained as inventory management issues (stock outs in certain sizes and colors). The market is also concerned that competition is finally making an impact with the success of other brands like Alo and Vuori. Some of the sell-side research that addresses competition concerns is reasonable. Morgan Stanley’s data suggests that store and web traffic growth was minimally impacted by competitors and Lululemon is still gaining overall market share.
And the U.S. consumer (especially for the mid to low end) is not doing well right now. The company has seen male guests pull back on certain categories and conversion rates dip slightly. The company is trying to combat that by focusing on releasing new fabrics and product lines, which is likely the right approach, but fixing this slowdown in just a few quarters is unlikely.
Optionality
Lululemon has shown that it can successfully expand into adjacent product categories. Over the past 6 years, Men’s has outgrown the women’s category by 6% annually to contribute 23% of revenues in 2023. The latest new product category is footwear. Lululemon launched the women’s footwear line under the Blissfeel brand in 2022. The company subsequently launched Restfeel, Chargefeel and Strongfeel. The men’s footwear launched in early 2024. Accessories (not including bags) is also an area that the company can grow into. That market is $110B globally, of which the company has less than 1% share. Accessories make up 10% of revenues for Lululemon.
If you made it this far, I hope you received some value from reading our analysis. Please subscribe to the newsletter and share with anyone that would find it valuable. Thank you for your support!
Hi, as always a very useful analysis. Just a small observation.
I have checked the 2022 and the 2023 annual reports and found that the data you refer as "operating margin" are actually (by the Company definitions) "Income from Operations" margin.
LULU reports "Income from Operations" data "(...) without taking into account our general corporate expenses and certain other expenses."
So I think that when you say that "(...) Operating Margins for the eCommerce business is also much higher at 42% in 2023 vs 27% for the stores" ... these are actually "Income from Operations" margins, (and those data are from the 2022 annual report because "(...) during the fourth quarter of 2023, has shifted resource allocation decisions to be focused by regional market, rather than by selling channel. This resulted in a change in the Company's operating segments.").
I think these are important clarifications in order to have common metrics with operating margins of competitors or other companies in general.
🚀Great dive. One thing I liked about your article that a lot of people dont is the necessary reinvestment required to propel forward with market share, better products, scale etc. You took that into account. Also like the vectors of growth section in terms of assessing TAM and SAM. I’m in a similar niche and I write about the broad market too, quite complementary so I really liked reading your article! Would love to support one another 👌🏽⚡️