

AGB 2023.5 - Brown & Brown (BRO)
AGB 2023.5 - Brown & Brown (BRO)
Consolidator of Middle Market Insurance Brokers

Subscribe to AGB - One analysis of a good business every five weeks.
Brown & Brown
“We have a unique business, and everybody says that. Everybody's business is unique. I'm just going to tell you Brown & Brown is a very decentralized, very flat management style organization where you actually are compensated individually as a leader or a producer on the results that you drive. So, if you run a business unit or multiple business units, your compensation is tied to the performance of that business unit, whether it'd be in an office, the office, a region, whatever the case may be. And so, we are about growing the business. And we are a business that is an operator of businesses. We are not an acquirer of businesses. We are an operator of businesses that happened to do a lot of acquisitions.” – Chief Executive Officer, J. Powell Brown, at the Barclays Global Financial Services Conferences in September 2013.
Brown & Brown is the 6th largest insurance broker based on 2022 revenues. The company acts as an intermediary between insurance carriers that provide and customers that need insurance products and services. Most of Brown & Brown’s insurance products are under the categories of property & casualty, employee benefits and personal insurance. The company also offers write-your-own flood insurance products through their subsidiary, Wright National Flood Insurance Company, and those products are backed by FEMA, which lowers underwriting risk of this product. Brown & Brown is primarily based in the U.S., with under 7% of revenues coming from international markets in 2022.
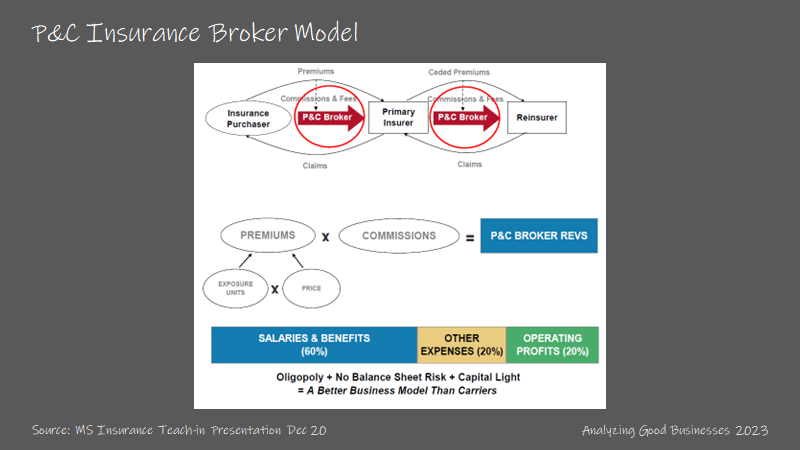
Insurance brokers sit between the supply and demand of the insurance supply chain by facilitating the purchase of insurance products as well as managing records and providing services. Carriers underwrite the risk of insurance while collecting a premium and seek the help of insurance brokers to find customers (usually commercial) to purchase their products. Brokers will work with many carrier partners to find the right insurance product (and price) for its customers. Brokers source new customers through their agents who sell to the business communities in those regions. Brokers typically don’t assume any underwriting risk and require little capital to run their businesses.
Brokers earn a commission for a successful sale, typically in the range of 10%-15% of the annual premiums placed. The commissions for personal lines of insurance are on average lower than commercial lines due to the increased complexity to commercial insurance. The drivers of revenues for insurance brokers are (1) fluctuations in “exposure units”, which can be thought of as the amount of dollars of value under coverage, and (2) changes in premium rates (prices). Exposure units can be impacted by the number of customers, the number of insured units by each customer, and changes in the values of the insured units. For Brown & Brown, the company states that growth is impacted 1/3 to 1/4 by changes in price and the remaining 2/3 to 3/4 by changes in exposure units. Brokers also earn fees, which are related to services that include third-party claims administration.

Pricing is an interesting dynamic for the insurance brokerage industry. Premiums for insurance products fluctuate, depending on supply and demand for insurance coverage. Let’s use a natural disaster as an example. After a flood or hurricane, there will be large losses by the carriers, with the magnitude depending on how disciplined the underwriting standards were. This will likely result in fewer carriers electing to cover that risk in the future, leading to reduced supply. Carriers that elect to remain in that market will raise prices to make up for the large losses and the reduced supply. On the demand side, more customers will try to gain coverage, even if they weren’t affected. And that supply demand imbalance creates a hard market. Insurance brokers typically benefit during a hard market because their commissions are based on a percentage of the premiums, leading to increased organic revenue growth.

The insurance brokerage industry has been undergoing a wave of consolidation for the past two decades. While the industry is still fragmented, the larger brokers have been acquiring many of its smaller competitors, usually at reasonable valuations. Because the industry experiences organic revenue growth between 0%-5% in normal markets and much higher than that in hard markets, these acquisitions are sustainable and self-funded. Aside from brokerage firms, banks also competed for acquisitions in the early 2000s. That shifted to private equity firms since the great financial crisis of 2008. Brown & Brown has stated that there over 30 private equity firms active in the space.
Brown & Brown is one of many insurance brokers, but there are some unique characteristics worth mentioning. First, the company operates under a decentralized model, where local branding isn’t necessarily under the Brown & Brown umbrella. This is especially true if Brown & Brown has acquired an established insurance brokerage firm in a region. Typically, the acquired company keeps its branding and Brown & Brown handles the back office and other needs. Each branch is responsible for their own P&L and most costs are allocated at the operating level. The company has stated that corporate overhead is 5.5% of revenue vs. 9%-18% for the industry.
Second, the company is still family run, even after 84 years of existence. Current CEO, J. Powell Brown has been CEO since 2009, succeeding his father J. Hyatt Brown, who is now chairman of the board. J. Hyatt Brown was the CEO for 48 years. The family owns 16% of the company, and the Brown & Brown employees own another 5%-6%. At least 60% of employees own stock in the company.
Third, the company mostly competes in the middle market (businesses wuth 20-1000 employees), which means dealing with fewer large customers and less competition from larger brokers. This ties in with the company’s decentralized model and branding. The middle-market represents 10%-15% of the firms in the U.S.
Brown & Brown segments their business into four buckets: Retail, National Programs, Wholesale Brokerage and Services.
Retail is the largest segment at 58% of revenues in 2022. This segment is the traditional outbound sales of insurance. Brown & Brown agents will meet with customers (usually commercial) a plan to purchase insurance coverage based on their needs. This segment has slightly below (1%-2%) EBITDAC margins at 31.9% vs. the company average of 33.2%.
National Programs represent 24% of revenues. This segment has increased as a percentage of revenues since over the past 20 years. National Programs are specialized insurance programs for niche markets (certain industries, trade groups and professions). The insurance carriers that support these products oftentimes give Brown & Brown authority to handle underwriting and claims administration for these programs. There are 40 programs that are offered, partnering with over 100 carriers. Catastrophic insurance programs are under this segment. National Programs has the highest EBITDAC margins at 40.1%.
Wholesale Brokerage represents 13% of revenues. This segment sells surplus commercial and personal lines of insurance to customers through a network of brokers. Typically agents of smaller brokerages that don’t have access to certain insurance products will utilize Brown & Brown’s wholesale offering. This segment has similar margins to Retail at 31.1%.
Services is the smallest segment at 5% of revenues. Fees are generated when Brown & Brown assists clients with claims administration and other services to policy holders. This segment has the lowest EBITDAC margins at 19.1% but is higher than others in the industry.
The company’s margins are the highest among the large publicly traded peers. Brown & Brown’s lean cost structure does help with its margin advantage but also its large exposure to National Programs, which tend to have EBITDAC margins in the range of 37%-40%, due to its lower employee costs in the segment. Brown & Brown targets EBITDAC margins of 30%-35%, and the company has been in the 30%-33% over the past 7 years.
Why is it a good business?
As one of the largest insurance brokers, Brown & Brown benefits from a few scale advantages. At a certain size, brokers generally have relationships with most insurance carriers and can offer a wider range of products for its customers than smaller brokers. Furthermore, scale allows brokers to offer Wholesale Brokerage products to a network of smaller brokers by leveraging its supplier relationships.
Scale also allows larger brokers to have better negotiating power with its carrier partners with respect to commissions. As brokers become a larger part of a carrier’s business, this power dynamic can work in favor of the broker. One carrier partner’s commissions rate can be used as a reference point to negotiate higher commissions with others. Carriers that depend on certain brokers for a large part of their business may have to comply, depending on the pricing environment and supply/demand dynamics.
Scale also gives Brown & Brown the ability to offer National Programs to its network of affiliate brokers. Because most National Programs are specifically targeted to a niche, carriers will oftentimes allow Brown & Brown to handle the design of the program as well as make underwriting decisions (while bearing no risk) and claims administration for its supplier partners. National Programs have higher margins as well, leading to better economics for the company.
While other large insurance brokers benefit from intangible assets or branding, it may be less impactful for Brown & Brown because of the decentralized nature of its business. As mentioned before, the company owns a collection brokers that oftentimes have their own branding. This is in contrast to other large brokers that assimilate acquired brokers to their own brand.

Specifically for Brown & Brown, the company competes in the middle-market, which represents 10%-15% of the businesses in the U.S. Brown & Brown may be advantaged participating in this market vs. the other larger brokers competing for national accounts. The company considers the local broker as its main competition in the retail business. Customers tend to be smaller in size and less sophisticated than large national accounts. These smaller customers rely more on brokers to find the right solutions for them and insurance carriers are willing to pay a high commission for these types of customers.
National accounts on the other hand are more sophisticated and likely already have a good idea of what insurance coverage that they need. National accounts will likely negotiate premiums down to a level where the insurance carriers may be reluctant to pay a high commission rate.
Returns on incremental capital?
Over the past 10 years, Brown & Brown has spent 6% of its capital on capex and 94% on acquisitions. The company’s capex spend is related to office and related fixtures and technology investments. In 2017, the company invested to upgrade its core financial, management reporting and policy management systems. This investment was for $30M-$40M over 3-4 years, which had a temporary 50-60bps impact on EBITDAC margins.

For growth, the company can either acquire existing brokerage businesses or hire new brokers internally. While there is internal hiring and training to support offices where demand is increasing, acquisitions have represented the bulk of Brown & Brown’s capital spend. Many of the other large insurance brokers have deployed this strategy as well. The industry is still fragmented (especially in the middle market) and there are many independent agency owners that are coming up on retirement age that may be looking to monetize their assets.
Brown & Brown looks for existing teams that have a cultural fit. The company estimates that 6 out of every 10 deals get thrown out because of a lack of cultural fit. The company usually can convince half of the remaining 4 to join Brown & Brown for a 20% hit rate. On the company side, new leads for acquisitions mainly come from internal sources and their relationships in the field. When a deal in brought for due diligence, there needs to be an internal sponsor to advocate the deal. This sponsor works with the acquisition team to see the deal through completion.
Brown & Brown typically pays for acquisitions in cash with an earnout over a 2-3 year period based on revenue growth and operating margin targets. The company has spent an average of $561M per year in acquisitions over the past 10 years. Brown & Brown discloses how much annual revenues are added from acquisitions each year and this number has averaged $163M for the past 10 years, which implies a price/revenue multiple of 3.5x. Because most acquisitions are small in the range of $10M-$40M, other valuation metrics are difficult to pinpoint. Taking a look at the larger public deals, the EV/EBITDA has ranged from 7x-12x for an average close to 10x EBITDA, or a 10% return on capital.

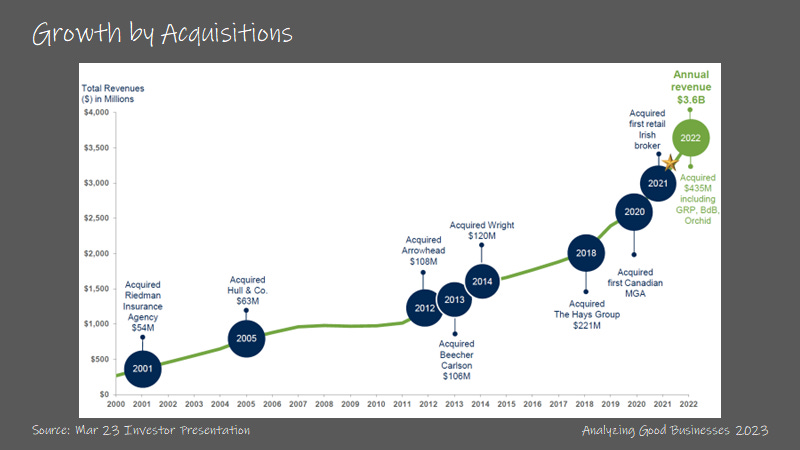
Looking at Brown & Brown’s recent history, here are the large deals that have added scale, geographical coverage or new capabilities for the company:
Wright Insurance was acquired in 2014 for $602.5M, at a valuation of 11.2x EBITDAC. While the valuation is above average, Wright Insurance had much higher margins than Brown & Brown because of its leading market share in write-your-own flood insurance (63% of Wright’s revenues at the time of acquisition). Remember that flood and other catastrophe insurance is a large part of Brown & Brown’s National Programs segment, which commands the highest margins for the company.
Hayes was acquired in 2018 for $605M, at a valuation of 14x EBITDAC. Hayes was a large deal (22nd largest insurance broker at the time) and it shored up Brown & Brown’s presence in the Midwest of the U.S. Hayes had retail locations in 21 states. While Hayes had lower margins than Brown & Brown at the time of acquisition, deal synergies of $10M-$15M and cross selling opportunities for National Programs would allow for margin accretion after the deal, effectively lowering the purchase multiple.
Global Risk Partners was acquired in 2022 for $1.8B, for a valuation multiple of 16x EBITDAC. This was the largest deal in the company’s history. GRP was the 3rd largest independent retail broker in the U.K. GRP allows the company to have a strong foothold in the U.K. and Ireland markets, where the company can make subsequent acquisitions of smaller insurance brokers in the region. Post the acquisition, international represents 12% of revenues, up from 7% in 2022 and less than 3% in 2021.
Over the past 10 years, Brown & Brown has made acquisitions across its 4 segments, but the mix has shifted from the prior decade. Retail accounted for more than half of the acquisition dollars at 54% (assuming an even split for GRP between Retail and National Programs), National Programs 39%, Wholesale Brokerage 5% and Services 2%. In the previous decade, Retail represented 40% of acquisition dollars, followed by National Programs, Wholesale Brokerage and Services each accounting for 20% of dollars spent.
We estimate that Brown & Brown generated returns on incremental capital between 12%-22% annually over the past 5 years. Because the company continues to show strong organic growth (and this was helped by the hard pricing market for the past 2+ years) while also acquiring middle-market brokers, the incremental capital returns are favorable and consistent. National Programs showcasing faster organic growth than the rest of the company also helps since this segment has the highest EBITDAC margins.
Reinvestment potential?
To calculate the addressable market from a top down perspective, you can compare written premiums across each geography that Brown & Brown participates. According to Swiss Re Institute Sigma Research, in the U.S. there were $1.9T of written premiums (not including life insurance) in 2021. If insurance brokers command 10%-15% of premiums as commissions, that would imply a market size of $190B-$285B in the U.S.

However, those estimates may be off by many magnitudes because (1) not all written premiums are broker driven, (2) not all contracts come with a commission (sometimes brokers are paid in fees instead), and (3) commission rates vary depending on the customer size and the product underwritten. Using that same data source, we can estimate that the insurance broker TAM in the U.K. is $10B-$15B based on written premiums of $99B. And the TAM in the Eurozone is $65B-$98B based on written premiums of $645B. The written premiums in the U.K. + Eurozone are 39% the size of the U.S.
Brown & Brown’s acquisition opportunity remains robust even though broker consolidation has been increasing over the past decade. In 2009, there were 195 U.S. insurance broker deals completed and that number increased to 560 deals by 2017. The top brokers and PE backed entities are consolidating the space because the economics remain favorable and there is enough excess FCF generation to fund deals, given the small amount of capital required the run an insurance brokerage business.
However, most of the deals that are available are small because most independent insurance brokerage agencies command less than $20M in revenues. Companies like Brown & Brown that can consolidate the middle-market should be better off, especially as smaller deals command lower multiples in the 7x-9x EBITDAC range, while larger deals command multiples in the range of 10x-12x or even higher.
For Brown & Brown the U.S. is still the largest opportunity as there are still many smaller local and regional insurance brokers that can be folded into the company. But with the recent acquisitions of GRP and BdB Holdings, the company has a decent foothold in the U.K., Ireland, France, Italy and Poland markets. Prior to the deals, GRP had a successful track record of acquiring and integrating smaller insurance brokers and the company has broad relationships with the U.K. and Eurozone carriers.
With a reinvestment rate between 50%-75% and a return on incremental capital between 12%-22%, we estimate that Brown & Brown has increased its intrinsic value between 9%-11% annually over the past 5 years. With the large acquisitions made in 2022, the company’s high reinvestment rate should allow for continued compounding of intrinsic value, even if the higher acquisition multiples put temporary pressure on returns on incremental capital.
What else is important?
Best time to own insurance brokers?
While insurance brokers as a group are generally viewed as strong compounders outperforming the market over many years, it may be useful to know when in the cycle to own these companies. Morgan Stanley has done a study where they found that brokers tend to outperform 2 years before and 2 years after the start of a P&C hard pricing market.
This is because brokers tend to benefit directly from higher pricing as commissions are based on a percentage of premiums and there tends to be meaningful operating leverage when pricing is driving organic revenue growth. We are currently 2+ years into a firming pricing market, so that explains some of the lift in organic revenue growth for Brown & Brown and the rest of the industry.

Looking back, the last time there was a soft market was between 2014-2017 and prior to that it was 2004-2010. The last time there was a prolonged hard market was between 2000-2003.
Optionality
To no one’s surprise, acquisitions will drive the upside optionality for Brown & Brown. International expansion is more likely now that the company has a strong foothold in many of the Eurozone markets. With prudent capital allocation (not overpaying) and a focus on organic revenue growth, especially with cross-selling, Brown & Brown should have nice tailwinds for growth going forward. Large acquisitions will always stress the debt ratios at this company like it did in 2022, but the consistent free cash flow generation should mean that Brown & Brown can make other large acquisitions in the near future.
If you made it this far, I hope you received some value from reading our analysis. Please subscribe to the newsletter and share with anyone that would find it valuable. Thank you for your support!
B+B acquired my father in laws brokerage a few years ago. Interesting to see thier approach to acquisitions like this.