Subscribe to AGB - One analysis of a good business every five weeks.
United Rentals
United Rentals is the largest equipment rental company in the world with a fleet of over 1M rental units in 4.6k different equipment classes offered at 1.5k locations. The company purchases construction and industrial equipment from its suppliers and rents the equipment to its customers for a fee. United maintains and services the equipment over its useful life cycle and then sells the equipment, usually to its customers, at the optimal time. Most of the company’s operations are in the U.S. and Canada (96% of locations), with a much smaller presence in Europe, Australia and New Zealand.
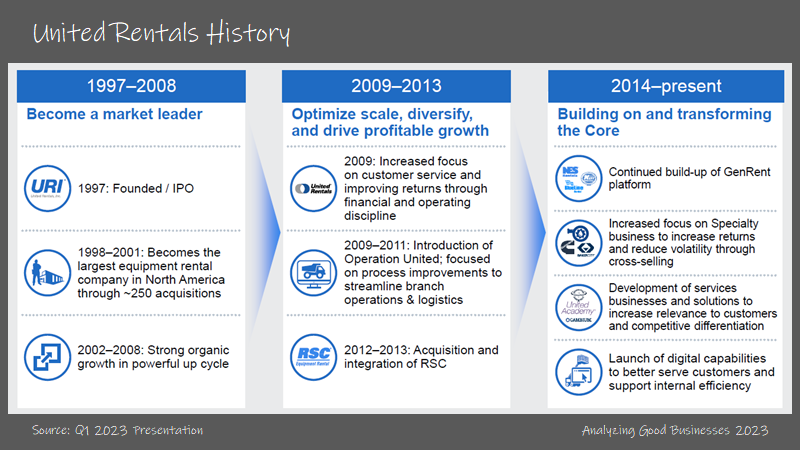
United has grown to be the industry leader through a series of acquisitions. The company was founded in 1997 and United quickly became the industry leader in just 13 months. Even as the industry has consolidated over time, the market still remains very fragmented. In 2010, United commanded 5% market share, followed by Sunbelt Rentals (subsidiary of Ashtead Group) at 4%, RSC (acquired by United in 2012) at 3% and Herc at 3%. Today, United commands 17% of the market with Sunbelt 13% and Herc 4%. Said another way, in 2010 the top 10 rental companies in the U.S. commanded 20% of the market, and that number increased to over 40% by 2021.
United’s main customers are construction and industrial companies. These customers require equipment for the construction and renovation of residential and commercial buildings, warehouses, manufacturing plants, office parks, etc. In 2022, United’s largest end markets were non-residential construction (47% of revenues), infrastructure, power, and oil & gas. Macro drivers of the rental market include construction activity (in particular non-residential spending for United) and infrastructure spending. United’s organic revenue growth tend to lead non-residential spending growth by a year.
The business dynamic between rental companies and their customers is interesting because customers typically own their own equipment and will also rent equipment for their jobs. The main reason customers will elect to rent equipment is because it’s more economical and convenient. Customers don’t have to worry about maintaining high equipment utilization (that falls onto the rental company), storage costs or performing service/maintenance. Customers also get access to a wide selection of equipment for different job types and can easily change the amount of equipment depending on future demand.
For an rental company to be successful, the name of the game is returns on capital. And a decent proxy for that is dollar utilization, which is a measure of revenue per year/original cost of equipment. This metric depends on how much time the equipment is rented for (time utilization) and how much revenue it generates per unit of time (rate). And it’s a balance of the two, especially when looking at the entire portfolio of equipment offered to customers, that leads to high dollar utilization. Here is Dale Asplund, EVP of Business Services talking about the balance at the company’s 2018 Investor Day.
“If I wanted to chase rate and only go after rate, I should buy only telehandlers and push that rate as hard as I can. It will lower my returns. It is the wrong decision. Rate is important but it's only part of the story. What about time? Time utilization is critical; I agree. Putting stuff on rent is critical. But there again, do I go chase more telehandlers because I can put them out at 81% of the time and give up those higher-return assets like skid steers that we know we can put on rent? It's a balance. Rate is important, time is important, but it's a balance that drives us to profitable growth and optimizing returns. These numbers are at the category level. If you imagine what this would look like when we aggregate all of our fleet together across all 1,200 markets to a single number and what the danger in that one single number could be for both rate and time.”
Different classes of equipment have varying time and dollar utilizations. For example, forklifts have a high time utilization at 72.8% (from Q4 2018 earnings presentation) but a below average dollar utilization at 38.6%. Company averages were 68.8% and 44% for 2018. Earth and moving equipment like excavators have below average time utilization at 64%, but better dollar utilization at 43.2%. And trench safety equipment, which classifies as specialty equipment, offers a lower time utilization at 59.3% but a much higher dollar utilization at 53.3%.
The types of rental equipment can be segregated into two categories. The first is general rentals (or “gen rents”). This is excavators, bulldozers, lifts, and other general construction equipment. Gen rents made up 66% of revenues for United in 2022. The second is specialty rentals like trench safety, HVAC, fluid solutions, portable storage, light equipment and tools. This made up 34% of revenues in 2022.
The company, as well as other players in the industry, recognized that specialty provides much higher dollar utilization and thus higher returns on capital than gen rent. This is due to higher average rates for specialty vs. general equipment, likely because of lower rental availability. The rent/own ratio of specialty is just 20%/80% vs. 60%/40% for gen rent. This means that there are fewer choices when customers are looking to rent specific specialty equipment and because of that, the rental company can charge more.
United’s specialty segment has increased at a compounded annual growth rate of 16.2% (including M&A) over the past 8 years. The gen rents segment has increased at a CAGR of 5.5% during the same time period. This is compared the overall market growth of 4.4%. Specialty has increased to 27% of rental equipment revenue in 2022 for United up from 7% in 2012. Specialty locations make up almost 30% of total locations at over 400.
The company hasn’t recently given out long-term growth targets. Perhaps they will give out targets at their upcoming Investor Day in May of 2023. That’s likely due to the cyclical nature of the industry. However, United does have a target leverage range of 2x-3x. United finished 2022 with a net debt/EBITDA of 2.1x.
Why is it a good business?
As the largest equipment rental company, United benefits from certain scale advantages. First, the company has more negotiating leverage (pricing and other terms) with its suppliers due to its large annual purchasing volume. In 2021, the company spent $3.4B in equipment purchases. By comparison, Herc, the #3 player spent $1.2B. As United has increased in size, the largest supplier for United has decreased from accounting for 24% of capex spend in 2014 to just 10% in 2022. And the top 10 suppliers have decreased from 68% to 45% during that same time period.
Second, United is able to service its large customers that require a variety of equipment, often times across many locations. For the company’s largest clients, United has a dedicated salesforce to service these accounts. National Account customers have an annual rental spend >$500k and do business across multiple states. In 2021, National Account customers contributed ~42% of revenues. The company can also cross-sell specialty equipment to many of its national accounts. For many of United’s recent acquisitions, cross-selling has been a contributor to revenue synergies, improving the returns of these deals.
And third, because the company has the highest density of rental locations across most regions, United can more easily transfer equipment from one location to another to service customers. This is important because equipment transfers typically result in higher equipment utilization and capital discipline for equipment purchases.
In recent years, the company has tried to further differentiate itself by investing in digital tools for its customers. There is still an opportunity for companies like United to increase efficiency for their customers through technology adoption. From the company’s 2018 Investor Day, United stated that $530B in economic value is lost every year due to a productivity gap in construction and related industries.
One of the main digital tools is Total Control, which allows certain key customers to manage their equipment needs. Customers can open and close rental contracts, view their invoices/pay bills, locate their equipment through GPS and manage their equipment utilization through the software. United’s sales teams can also provide customer service through the software program. Customers that use Total Control have realized savings up to 20% of their total rental costs (statistic from the company’s 2018 Investor Day), through higher utilization rates and more productivity.
Returns on incremental capital?
Over the past 10 years, United has spent 2/3 of its capital on capex and 1/3 on acquisitions. Most of the company’s capex spend (90%-95%) is related to purchases of equipment rentals. United typically contracts for 70%-80% of its annual capex spend by the end of the first quarter. And purchasing terms are adjustable with a 30-45 day notice, which allows the company to flex purchases up and down depending on changes in the demand environment.
Near the end of the life-cycle for United’s rental equipment, the company sells the unit, usually to its customers. As the rental unit ages, the revenues it commands decreases (newer equipment have more features, is in better condition, etc.) and the repair & maintenance costs increase. This causes the resale value of the equipment to trend lower. United tinkers with the optimal age to sell the piece of equipment based on these factors and the strength of the used equipment market at the time. In general, when the rental market is stronger, United will elect to sell less equipment and vice versa.
Sales of United’s rental equipment offsets 34% of capex spend on average. The average sale price as compared to the original purchase price is actually much higher. At the company’s 2018 Investor Day, United gave examples of the total cost of ownership for three separate brands. The resale values ranged between 54%-63% of the original purchase price. It’s worth nothing that the margins United achieves on selling rental units is near the company average.
On the M&A front, United has made over 300 acquisitions, most of which were small tuck-ins during the first 10 years of the company’s history. The meaningful acquisitions provide access to new customers, allow cross-selling opportunities for specialty rentals and expand the company’s geographic coverage. And because industry multiples are low and most of the value is in the equipment and rental locations (there are usually significant tax advantages for the buyer), the returns for even the large acquisitions are attractive. The average transaction value for United’s large deals over the past 10+ years has been 7.7x EV/EBITDA, 6.4x EV/EBITDA including synergies and 5.3x EV/EBITDA including synergies and cross-sell. That implies an estimated return of 13%, 15.6% and 18.9%.
Since 2012, the company has made 5 acquisitions over $1B, starting with RSC.
2012 – RSC
3rd largest rental company at the time. Gained more exposure to industrial customers and significantly increased scale
$4.2B (60%/40% cash/stock), implying an EV/EBITDA of 5.6x post synergies
$230M-$250M in cost savings (2/3 in the first 12 months)
2017 – Neff
Gained exposure in Southern region and infrastructure customers
$1.3B, implying a EB/EBITDA of 4.5x including tax benefits, synergies and cross-selling
$35M in cost savings, $15M in cross-selling and $220M in tax benefits
2018 – BlueLine
Gained exposure to mid-sized customers
$2.1B, implying an EV/EBITDA of 5.4x including tax benefits, synergies and cross-selling
$45M in cost savings, $35M in cross-selling and $169M in tax benefits
2021 – General Finance
Gained a specialty offering of mobile storage and portable office in the U.S. and Australia/New Zealand
$1B, implying a EV/EBITDA of 5.7x including synergies and cross-selling
$17M in cost savings and $65M in cross-selling
2022 – Ahern
8th largest rental company. Gained a higher mix fleet of aerial equipment and forklifts
$2B, implying a EV/EBITDA of 4.5x including tax benefits, synergies and cross-selling
$40M in cost savings, $60M in cross selling and $426M in tax benefits
We estimate that United generated returns on incremental capital between 10%-15% over the past 6 years. The company’s returns in 2020 were impacted due to the Covid related slowdown in industrial production and construction projects. United was able to quickly reduce the amount of equipment purchases and elected to sell more equipment than usual during this time to help mitigate the margin decline with the slowdown in revenue.
Reinvestment potential?
The rental market in North America was ~$60B in 2022 and is growing between 4%-6% per year (increased 4.4% CAGR for last 8 years). Reasons for this growth are continued penetration of rent vs. owned equipment in gen rent, improvements in rental efficiency with the adoption of technology and the growth in specialty rentals. In 2009, the rent/own ratio for gen rent was 42%/58% and that’s moved higher to 60%/40% by 2022.
Even as the largest rental company with 17% market share, United still has ample opportunity to gain market share. United generated $1.76B of FCF in 2022 and can use its excess debt capacity to acquire more competitors. As mentioned before, the multiples for rental companies are low, especially after incorporating cost synergies and the tax savings due to the step up in assets from the acquisition. United has a net debt/EBITDA of 2.1x. If you consider the company’s top of the range at 3x, United can add almost another $5B in debt to make any large acquisitions.
United should also benefit from the $1.2T Infrastructure Investment and Jobs Act that was signed in 2021. Funding for many of these public projects are just now underway, which means more demand for rental equipment to service these contracts. Infrastructure contributes almost 15% of revenues for United, so it can be a meaningful tailwind for many years.
Specific to United, the company can also increase fleet productivity to increase its revenues and margins. Fleet productivity is a measure of the change in rental rates, time utilization and mix among the various types of equipment (which have different dollar utilizations). Technology adoption has been contributing to United’s effort to increase fleet productivity.
With a reinvestment rate between 60%-80% and a return on incremental capital between 10%-15%, we estimate that United has increased its intrinsic value between 8%-9% over the past 6 years. It’s interesting that the valuation multiples for rental companies are consistently low, even during periods of high rental equipment demand. This allows United to purchase companies 5x-6x EV/EBITDA after considering synergies, cross-sell and tax benefits. And because of the company’s long history of integrating successful acquisitions, the company’s M&A strategy should continue to be value accretive for the long-term.
What else is important?
Cyclicality
There is a narrative that United and the rest of the rental equipment industry are less cyclical than during the great recession. This is partially true because United is less exposed to general construction this time around, with higher exposure to infrastructure, MRO and specialty rentals. The company is also better capitalized with a net debt/EBITDA of 2.1x vs. 3.1x in 2008 (EBITDA was only minimally impacted in 2008). But United is still a cyclical company that will have big swings in revenue and earnings, depending on the macro environment.
The company has been able to show that it can mitigate some of the demand volatility by adjusting its cost structure. We saw this play out during the Covid slowdown in 2020. The company was able to shift human resources to in-source some services like delivery and repair & maintenance. United also was able to quickly reduce capex spend (the benefit of short purchase lead times), reducing rental equipment capex by 55% vs. 2019. And since overall equipment utilization was in decline, the company did elect to sell more rental equipment than it normally did. It can be debated as to whether it the right move since the industry saw a sharp rebound in 2021, but it does show that United has options to raise cash when necessary.
Optionality
United’s M&A strategy has propelled the company into the largest equipment rental company. And because the company’s market share is just 17%, United should be able to continue with its M&A strategy for some time. Even though the company doesn’t benefit too much strategically from acquiring another competitor, the valuation multiples are low enough that the return on capital are accretive to value.
International expansion is an area that United can invest more in the future. The company currently has a small presence in Europe and Australia/New Zealand from the Baker and General Finance acquisitions. In the future when United gets much larger in the U.S., international expansion may be a better investment of capital.
If you made it this far, I hope you received some value from reading our analysis. Please subscribe to the newsletter and share with anyone that would find it valuable. Thank you for your support!
Most excellent work friend!
Nice write-up. When I did the historical RoIIC including acquisitions & stock paid out for acquisitions I get a 5-yr RoIIC of 7-11% including goodwill. I guess part of the higher RoIIC going forward is the option to invest in these business @ TBV vs. FMV (including GW) but this would be offset by any acquisitions they make to sustain a higher growth rate. Ashtead has RoIICs in the 16-17% range with growth much more tilted towards organic growth (about 67% of growth) & probably more tilted towards clustering of smaller & mid-sized customers. Ashtead has about a 2% high dollar utilization (5-yr average of 54% vs. 52%) reflecting the clustering focus despite its smaller size & with only about 50% of the markets clustered. I have not seen any type of clustering discussion in URIs investor materials, have you?