

AGB 2022.8 - Old Dominion Freight Line (ODFL)
AGB 2022.8 - Old Dominion Freight Line (ODFL)
Secular Winner in a Cyclical Industry

Subscribe to AGB - One analysis of a good business every three weeks.
Old Dominion Freight Lines
“There are three major elements of capacity with an LTL: doors at our service centers, our equipment and our people. Doors can be the most limiting form of capacity in the short term, which is why we try to stay several years ahead of our anticipated growth curve. We have invested $1.7 billion in our service center network over the past 10 years, which has allowed us to expand our door count by over 50%.” - Chief Executive Officer, Greg Gantt, on the Q2 2021 earnings call.
Old Dominion is the 2nd largest LTL (less than truckload) carrier in North America based on 2021 revenues. The company was founded in 1934 as a one truck operation servicing a route between Richmond and Norfolk, Virginia. Since then, Old Dominion has grown to over 10k tractors and 41k trailers and 251 service centers in all 6 major regions of the U.S. As of 2021, the company commands 10% of the LTL market with the highest operating margins in the industry.
Trucking represents roughly 80% of the freight transportation in the U.S. with over $900B in collective revenues in 2020. LTL is a subset of that number (usually 4%-6%). Typically TL (truckload) freight transport is a single lane, point to point move. The logistics involved for TL shipments are minimal and typically don’t involve offloading or sorting of goods to optimize the space inside the trailer of a truck. The customer buys freight service for a full truckload worth of goods (or many truckloads) to be transported from one point to another.
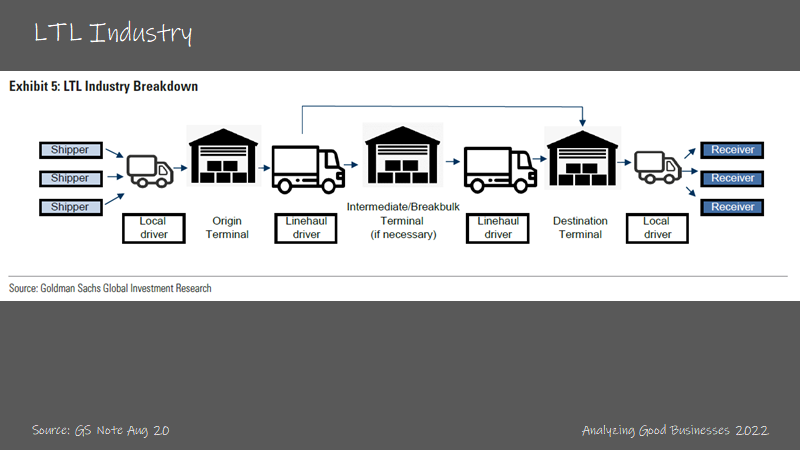
LTL is for customers that want their goods transported but don’t have enough volume to make up a full truck load. While carriers could run LTL freight in a similar fashion to TL (from point to point), it would be very inefficient to transport less than a full truckload on its own. To efficiently transport these goods, carriers need to combine many LTL shipments into one truckload headed to the same region and this is done through offloading and sorting of these goods at a local service center.
Service centers are used as hubs within a certain region or MSA. Within the region that a service center is located, route density plays a big part in the level of efficiency that can be achieved. And within each service center, the number of doors is the gating factor as to how much capacity can be moved through a service center. Typically, a service center will have room for expansion of additional doors if the company estimates that more freight will be transported through that service center in the future.
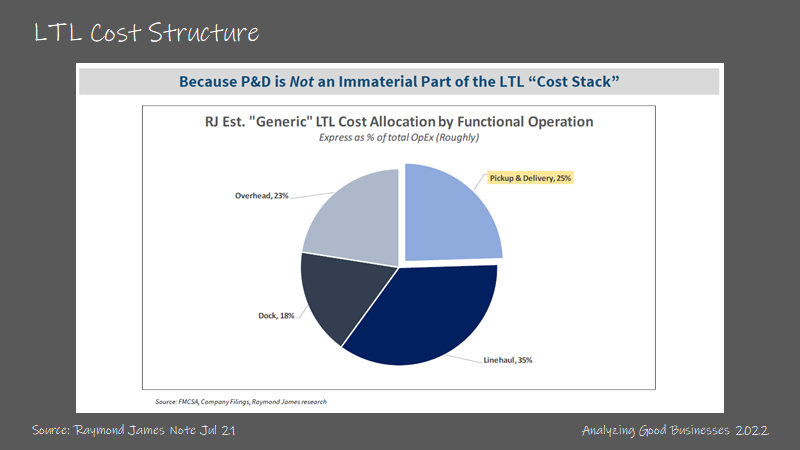
With pick-up and delivery estimated to be roughly 25% of the costs to running an LTL operation, lowering the driving distance and time between pick-up and delivery locations and the service centers in a region is important. Minimizing drive times and increasing average route density is a key factor to increasing efficiency.
Old Dominion is the most vertically integrated LTL freight operation. The company owns most of its service centers and does most of its linehaul deliveries themselves. Old Dominion also has 43 maintenance centers to service their fleet as needed. The company believes that having ownership over most aspects of the business results in higher quality control. As a result, Old Dominion had over 99% on-time deliveries and less than 0.1% cargo claims by its customers in 2021. This up from 94% on-time deliveries and 1.6% cargo claims in 2002.
With the company’s superior track record of quality service, Old Dominion has outgrown the industry by a wide margin over the past decade. In anticipation of that growth, the company has consistently maintained a 20%-25% latent door capacity at its service centers. This means that while the company is achieving the highest operating margins in the industry, Old Dominion isn’t operating its service centers near peak utilization and would rather have the extra capacity in case excess demand comes their way.
Old Dominion also invests in its fleet of trucks in advance of demand. While the company can’t have 20%-25% latent trucking capacity (like it does with service centers) because trucks and trailers depreciate much quicker than service center locations, the operating philosophy is the same. Typically new tractors are used for line-haul in the early life (3-5 years) and then transferred to pick-up and delivery for the remainder of their useful lives. The company has invested to keep the fleet newer in case the company would need to delay purchases of new trucks. The average age of its tractors declined from 4.8 years in 2013 to 3.8 years in 2019 and this number moved up to 5 years by 2021. The age of pick-up and delivery trailers went down from 13.2 years in 2012 to 7.5 years in 2021.
This and the company culture has resulted in better management of human capital. Old Dominion estimates that the company has less employee turnover than the rest of the industry. Front line employee turnover is estimated to be 8%-9% (much lower than the industry average). And because employees increase in productivity over the first year and a half of employment, it’s in the company’s best interest to hire ahead of when demand picks up.
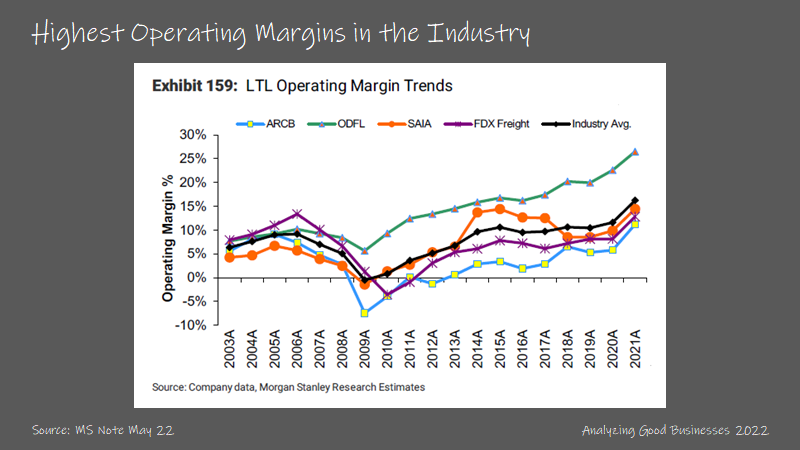
These factors lead to the company’s superior operating margins. Old Dominion periodically gives out an incremental margin number, which has been near 25% of many years (though it went as high as 40% in 2020). The company’s operating margin increased from 13.4% in 2012 to 26.5% in 2021. After beating 25% margins in 2021, Old Dominion put out a new target of reaching 30+% operating margin in the future.
It may be difficult to see much more improvement, since variable costs make up between 60%-65% of revenues. There will likely be a ceiling to operating margins, unless the company can improve the variable component of its cost structure. We also point out that the company doesn’t run the business to operating margins (or operating ratio), but rather revenues/shipment and profit on a customer by customer basis.
Why is it a good business?
As the 2nd largest LTL carrier in the U.S., Old Dominion benefits from scale advantages. At the regional level, the company’s scale allows for more route density for pick-up and delivery. This has both to do with having more service centers within a certain region and more customers within a single tuck lane. With higher route density, there is natural leverage of the fixed costs of the business.
At the national level, the company benefits from having some more leverage when negotiating with providers of tractors and trailers. Old Dominion also has better success with larger customers. The company's largest customer has increased from 2.6% of revenues in 2012 to 5.4% of revenues in 2021. The top 5, top 10 and top 20 customers in aggregate have also followed this trend, contributing to more to the company’s revenues over the past decade.
Old Dominion competes against both regional and national players. Against regional players, the company has better service capabilities because the company controls both the regional pick-up and delivery routes as well as the line-haul national routes. The company can also afford to adopt more technology into their service centers to help with efficiency (like RFID tags on their pallets) and safety measures for their fleet of trucks like lane departure warning systems and radar collision mitigation systems. Against the national players, Old Dominion can do 2 to 3 days faster delivery on cross country (due to the same reasons above) with fewer customer claims, according to the company.
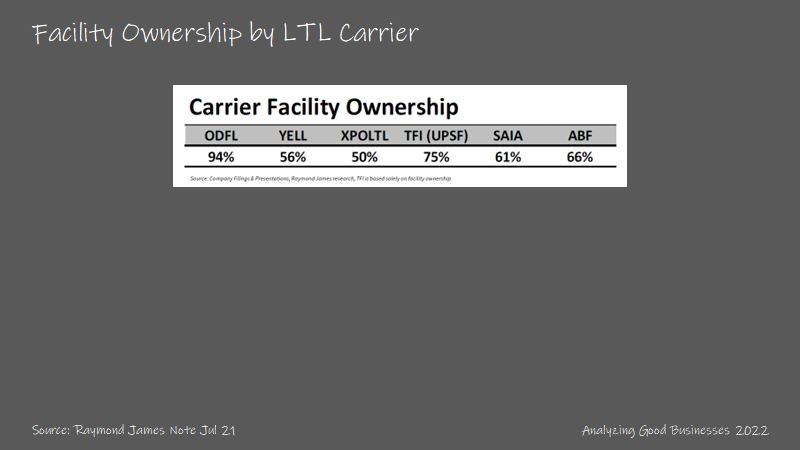
One thing that has benefited Old Dominion over the years, is the company’s choice to own more of their service centers. The company owns over 90% of their service centers (95% of door capacity), and this is materially higher than most of the competition. This number has increased from 71.5% in 2013, the first year the company started to disclose that metric. The main benefits to owning service center locations are the more predictable costs and having the option to expand service centers with much more ease. Typically, when Old Dominion acquires a plot of land to build a new service center, there is ample room for future expansion of more doors.
Other strategic choices that have benefited the company over the years are: (1) the high level of ownership across all of its services, including its fleet maintenance centers, (2) having latent capacity at service centers to meet surging demand, and (3) maintaining higher operating margins so that more capital can be reinvested back into the business.
A tailwind that is benefiting the LTL industry is the growth in eCommerce. While retail goods only represent 25% of Old Dominion’s freight (~60% is industrial), retailers investing into eCommerce infrastructure has helped the LTL industry. Distribution centers are getting closer to the customer as well as increasing in number, which means there is a growing need for next day and 2nd day LTL trucking lanes, since most e-Commerce freight is smaller in size.
Returns on incremental capital?
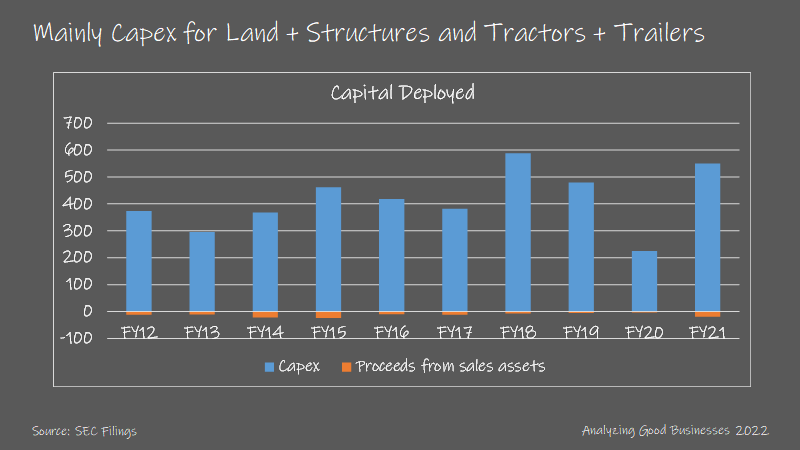
Over the past 10 years, Old Dominion has spent 100% of its capital on capex. Over 45% of the capex was spent on land and structures, over 45% was spent on tractors and trailers, and the remaining 5%-10% was spent on technology and other equipment. Capex as a percentage of revenues ranges between 12%-15%. Similar to Copart, because a lot of the capex is spent on land purchases, depreciation expense is much lower than capex, since land is not depreciable. Depreciation expense ranges between 5%-6% of revenues.
While the company hasn’t made any acquisitions over the past decade, Old Dominion has acquired LTL companies in the past. From 1998 to 2008, the company made 7 acquisitions. Most were to fill out a presence in underserved regions like in the Western and Mountain regions of the U.S.

Going forward, the company isn’t looking to make anymore tuck-in acquisitions. Here is the company’s CEO, Greg Gantt, explaining his reasoning on the Q2 2021 earnings call:
But at this point, we certainly aren't looking to acquire another LTL. I'm not sure that makes sense. And at the same time, if you go back through the history of acquisitions, certainly, major ones, we haven't seen a whole lot of success. And I don't think we want to wade into that at this point. But we certainly did our share back in the day, but most of those are smaller tuck-ins in geographies where we had needs and those kind of things. So, just – our needs are different today than what they used to be. And at this point, we have no real strong appetite for that.
In terms of unit economics, it’s difficult to parse out what the returns are for building out a new service center (again similar to Copart). The reasons for this are twofold. First, with each incremental service center build the benefit to the surrounding service centers are different. This largely depends on (1) the demand saturation in the region, (2) how much of a benefit to route density occurs due to the new service center, and (3) the location of the new service center relative to other important points of pick-up and delivery (like a railroad station). Furthermore, a large portion of Old Dominion’s capex is actually spent on service center expansion vs. new service centers, which complicates the analysis even more.
Second, each service center differs in size and cost, depending on the region. Raymond James estimates that the cost to build a door for the LTL industry is between $150k-$300k, which is inline with commentary around what the company has said about its own expansion of doors.
On the 4Q 2021 earnings call, the company stated that Old Dominion spent $1.8B over the past 10 years to increase the company’s door count by ~50%. In the 2020 10-K (Old Dominion didn’t provide this in the 2021 10-K), the company lists the number of doors for its top 9 service centers. Similarly in the 2012 10-K, the company lists the door count for the top 10 service centers. Extrapolating the growth in doors of the top service centers, we can estimate that Old Dominion has roughly 25k doors, and that the average capex spend per incremental door over the past decade was ~$250k.
We estimate that Old Dominion generated returns on incremental capital between 25%-35% over the past 4 years. It’s interesting that the returns on capital have been fairly consistent over the past decade, considering the company participates in a very cyclical industry. Having said that, we recognize that the pull-backs in demand have been short lived since the great financial crisis of ‘08/’09. As expected, the incremental returns were lower in 2016/2017 and in 2020, but rebounded nicely subsequently.
What is impressive is that Old Dominion was able to achieve these average incremental returns with very little debt on the balance sheet (held a net cash position since 2017) and having latent capacity between 20%-25% at its service centers.
Reinvestment potential?
Over the past decade, all of Old Dominion’s growth has been organic, which has been the direct result of company’s reinvestment back into its business. Because the growth of an LTL business is capex constrained (additional service centers + fleet is required), the company’s philosophy of reinvesting ahead of growth has served them well. Old Dominion’s market share in all 6 major regions of the U.S. have increased from 5.5%-8% in 2010 to 10%-14% in 2021.

The company’s capacity expansion is actually an outlier in the industry. Since 2007, industry wide LTL capacity is down 20%+ in terms of service centers. Some of this has to do with the less competitive LTL companies going out of business during this time period. Since 1993, the top 10 closures have resulted in $4.5B of revenues being shifted to other LTL carriers. Some of the capacity coming down also has to do with the industry becoming more efficient, as many of the larger carriers have consolidated service centers with each service center housing more doors.
Given the lack of capacity expansion, the LTL market hasn’t really increased since 2011 when industry revenues were $47B vs. $50B in 2021. At over 10% market share, Old Dominion is a lot larger than than it was two decades ago, but most of its competitors have not grown (other than FedEx Freight and Saia). And without industry level growth it begs the question of how large the company can get over time. The largest LTL company, FedEx Freight, is only ~20% larger than Old Dominion in terms of revenues but ~50% larger in terms of shipments.
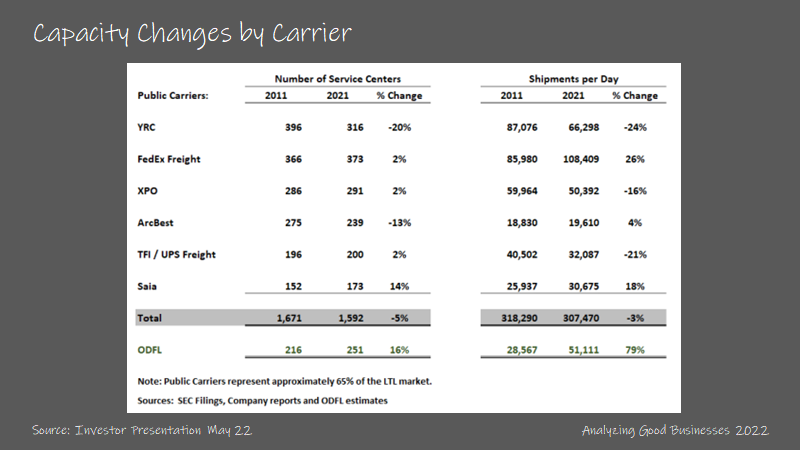
In terms of service centers, the company’s current plan is to invest in service centers up to 275, which would put them into 2024 at the current growth rate from the current 251. Looking at the larger competition, Fedex Freight has 373 service centers, YRC has 316 and XPO has 291. Old Dominion’s footprint in the largest 10 MSAs also point to more opportunity for expansion has the company lags behind all three.
Old Dominion has been able to fund its reinvestment through internal cash generation. But even with an above industry average reinvestment rate, the company has excess cash. With the cash, the balance sheet is strong with net cash over $600M. And the company was able to institute a dividend in 2017 ($293M paid so far total) and buyback $1.6B of its stock since 2014.
With a reinvestment rate between 35%-50% and a return on incremental capital between 25%-35%, we estimate that Old Dominion has increased its intrinsic value between 12%-14% over the past 4 years. The reinvestment rate is more consistent than the incremental returns on capital because the company tends to invest even during industry slowdowns and is always looking to build out capacity ahead of demand.
What else is important?
Cyclicality
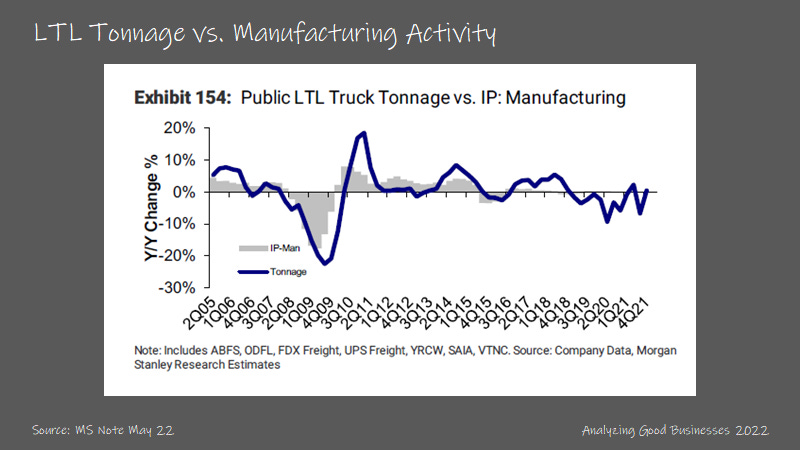
While Old Dominion is one of the best operators in the LTL industry, company fundamentals are still largely dependent on the trajectory of the U.S. economy. The industry and company are cyclical in nature, more so than other companies that we’ve analyzed so far. Industry level LTL tonnage growth are influenced by industrial manufacturing and retail demand trends. And as we’ve seen from the economic data this year, these data points are trending the other way.
There is also the nuance of the relationship between TL and LTL freight. While TL freight tends to be much heavier than LTL, there is still some spill over when capacity is tight. As an example in 2014, TL capacity was tight and LTL companies saw a surge in freight volume, which resulted in higher industry wide revenues by 4.2% vs. 2013. This excess demand flowed the other way the following year as capacity loosened on the TL side.
Surge in fuel prices
There could be some concern that a surge in fuel prices would have a negative impact to LTL industry and Old Dominion’s earnings. The company doesn’t hedge against the risk of diesel price increases but the company’s pricing strategy already has a natural hedge against rising and falling fuel prices. There are fuel surcharge programs in place on customer contracts, which is just an additional charge based on fuel costs.
And while Old Dominion’s goal is to break even on the fuel surcharge program, when there are spikes in fuel costs like we’re seeing today, the benefits of the program tend to lag so that the company sees some of the negative impact from the rising fuel costs. Furthermore, because the company can’t charge customers for empty miles driven (when there is no freight in the back of the trailer), higher fuel costs, all else equal, is a net negative for the company.
Optionality
There isn’t much optionality to the business, but rather just continued operating improvements during growth periods. There isn’t M&A that would make sense since Old Dominion is already a national LTL carrier. It could make sense to expand more internationally to either Canada or Mexico, but the investment to build out the service center network could mean the initial returns would be much lower than the current opportunity of reinvesting in the U.S. business.
If you made it this far, I hope you received some value from reading our analysis. Please subscribe to the newsletter and share with anyone that would find it valuable. Thank you for your support!
Great write up.
Can I ask a question:
Have you seen any data that directly evidences OD's route density vs peers? What metric would best reflect this?
Thank you.
Thanks, very informative! What are "Dock" costs, the ones that form 18% of the cost stack?