Subscribe to AGB - One analysis of a good business every two weeks.
Tractor Supply
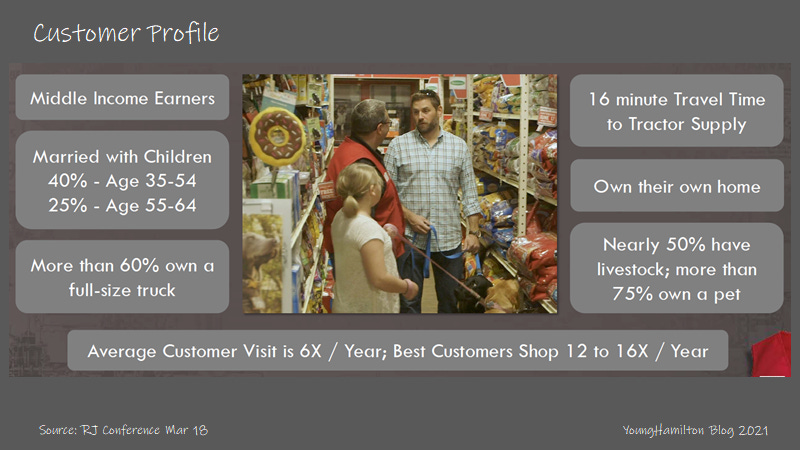
Tractor Supply is the largest retailer specifically targeting rural/semirural customers in the U.S. The average customer is a middle-income earner, married with children, owns a home and most importantly owns livestock (~50%) or a pet (~75%). Average customers shop 6 times per year and the best customers shop 2x-3x that number. Some of Tractor Supply’s customers are recreational farmers or ranchers but most are just living the rural/semirural lifestyle and shop at Tractor Supply for their everyday needs.
Most of the products sold at Tractor Supply are in the livestock and pet category (47% in FY20), which includes feed, bedding, seeds, etc. These products tend to have below than average gross margins but are very productive on a per square foot basis. They also drive foot traffic to the store. Many stores also offer pet services like PetVet clinic and PetWash centers. Hardware and tools (21%) and Seasonal products (21%) make up the bulk of the remainder of the goods sold at the store. Tractor Supply typically doesn’t compete on price and customers choose to shop there for the curated selection of goods that meet their lifestyle needs.
Tractor Supply stores are typically between 15k and 18k square feet with an additional 15k of outdoor space that the company is actively transforming to be a productive selling space (Side Lot project). There are typically 15k-20k SKUs offered in store and over 125k in the online store. The company also has over 20 exclusive brands, which are slightly different from traditional private label. Each of these brands like 4health in pet foods and supplies and Ridgecut in apparel are unique and are not under an Tractor Supply umbrella brand. They benefit from similar characteristics of private label brands. Pricing is typically 20%-30% lower than a comparable branded product and margins to Tractor Supply are usually 400bps-500bps higher. Exclusive brands made up 29% of revenues in FY20.
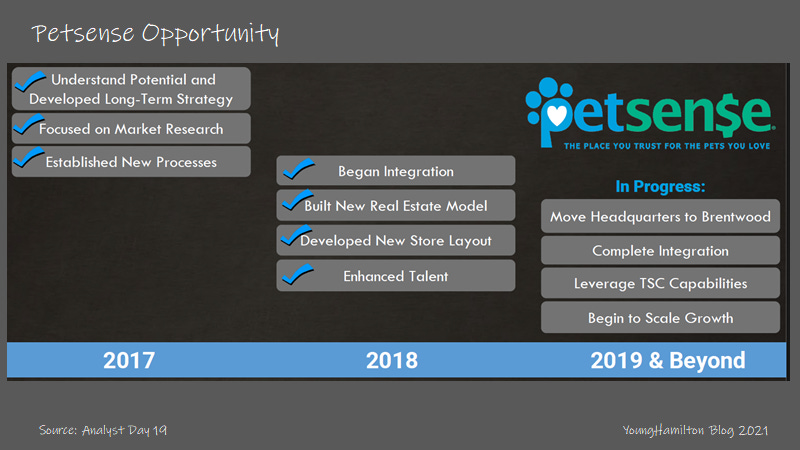
The company also owns a specialty pet supply retailer called Petsense which has a smaller store format of 5.5k sq ft. This business was acquired in 2016 after the company determined that there was a segment of the rural pet market that wasn’t being targeted by Tactor Supply stores. Only 10% of customers shop at both Tractor Supply and Petsense.
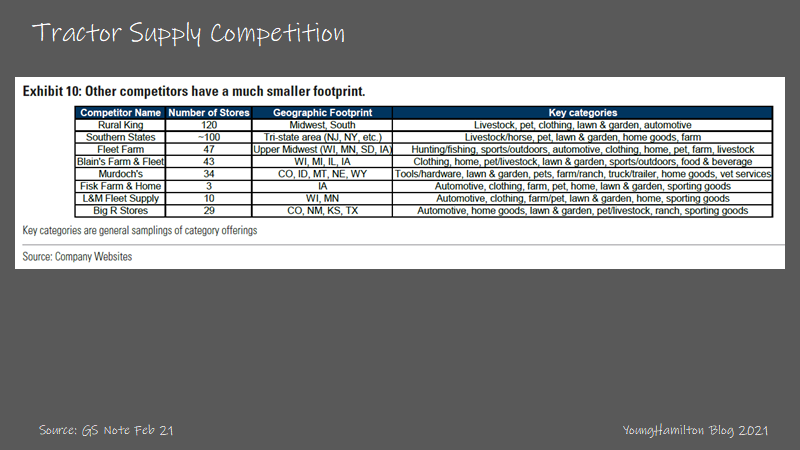
The market for rural/semirural retail is fragmented with Tractor Supply leading the way with 10% market share. The company is larger than the next closest competitor by a factor of 11x in terms of store count and no other competitors come close to having national scale.
Over the past 10 years, Tractor Supply has grown by adding 80-115 new stores annually, which accounted for average new store sales of $316M/year or roughly +5.5% growth. Tractor Supply’s store count has increased from 930 at the end of FY10 to 1,844 by the end of FY20. Comp store sales growth has averaged +6% during this period, but was just +4.1% if you exclude the big comp lift in FY20.
Tractor Supply is at the later stages of the store expansion phase of its life cycle. The company has identified ~650 more sites for new stores, which will take roughly 8 years to complete if you assume 80 new stores per year. However, the company is in the early stages of the efficiency gains phase of its life cycle. The pandemic has accelerated a lot of these improvements, but here is what the company has achieved over the past few years:
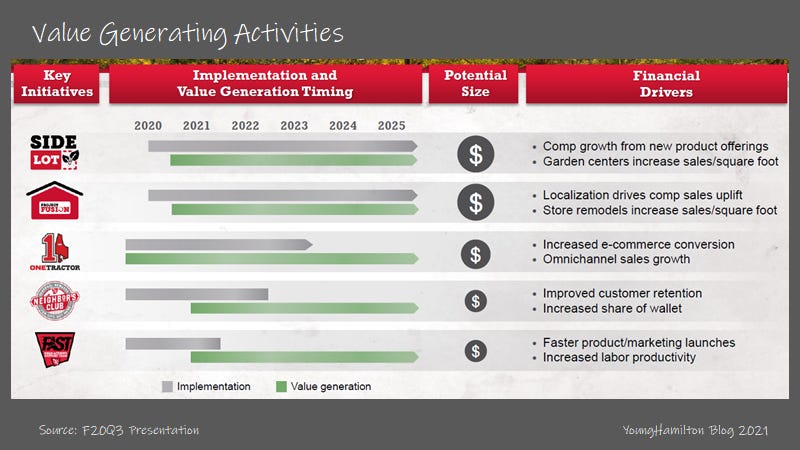
Loyalty Program (Neighbor’s Club) – Data collection, which leads to targeted marketing, more repeat purchases and better product assortment
Private Label Credit Card – Similar effects to Neighbors’ Club, also increases purchase sizes by 30% per card holder
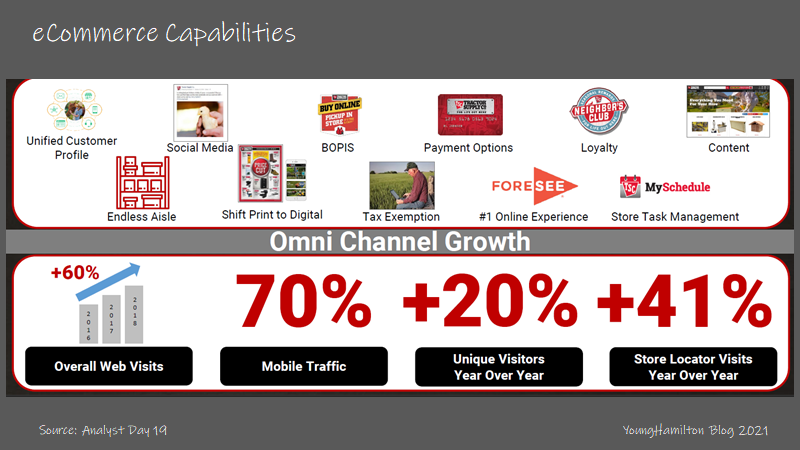
eCommerce operation (ship to store and next day delivery) – Expand customer set, reduce friction for customers
Improving instore layouts (Fusion) – Less friction for customers, improve merchandising efforts
Revamping outdoor area (Side Lot) – Increase sales/sq ft of the store, tap into lawn and garden opportunity
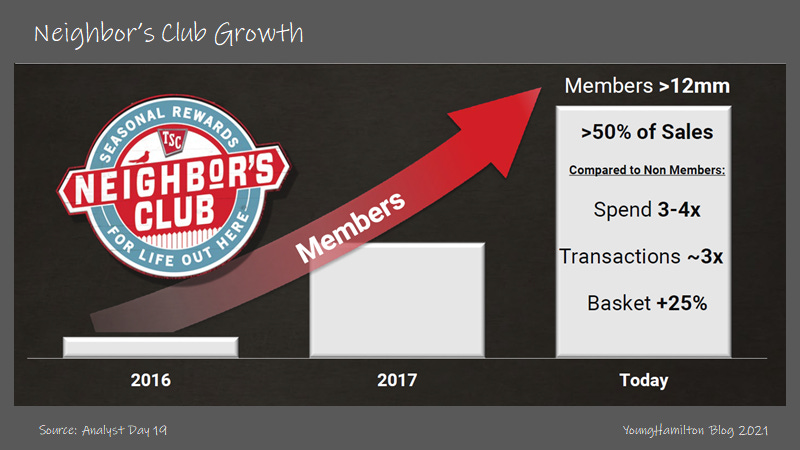
Specifically, the loyalty program and private label credit card allow the company to know their customer better and thereby offer more value. Neighbor’s Club was launched in 2015 and the company has quickly amassed over 21M members in the program. Members get points (for cash back) and the percentages move up as the members’ annual spends increase. Tractor Supply has found that members spend 3x more than non-members and their basket sizes are 25% larger. Members contribute to over 65% of the total company sales. It’s estimated that Tractor Supply had 45M customers in the 2018/2019 timeframe, but that number has moved much higher during the pandemic to over 55M+. At 21M members, Neighbors Club represents almost 40% of the total customers for Tractor Supply.
The private label card was introduced so that customers who wanted credit to purchase larger ticket items could do so. Private label card members are enrolled in the Neighbor’s Club program at the highest tier and earn more points per dollar spent. Tender share for the card was 3% in 2017, 4% in 2018 and the company is targeting 10% in 3 to 5 years time. The best-in-class retailers with private label credit cards have almost 20% tender share for their cards.
If you look at Home Depot’s evolution over the past 10 years, you see the changes in outputs like sales/sq ft and return on capital when the company transitioned from its store expansion phase to efficiency gains phase. Home Depot’s sales/sq ft growth from 2000 to 2008 (the last year where store units increased more than 1%) ranged from -19% to +7% for an average of -2%. The 2007 and 2008 numbers may not be as meaningful due to the housing bubble/great financial crisis. So, the average sales/sq ft growth from 2000 to 2006 is about +2%. Starting in 2010, Home Depot slowed its new store growth to +0.2% annually and instead focused on efficiency gains and eCommerce. This resulted in sales/sq ft growth of +7% annually from 2010 to 2020. Home Depot is an interesting comparison because Tractor Supply’s new CEO, Hal Lawton, spent 10 years at Home Depot from 2005 to 2015.
Looking ahead, the long-term financial model is +4%-5% in comp store sales growth plus an additional +2% from new store openings, which equates to +6%-7% total sales growth. That’s a lift from the prior +3%-4% LT target, due to the upgrades that are happening in the store (Fusion) and outside of the store (Side Lot). The company is guiding to 9%-9.5% EBIT margins long-term, which may prove to be conservative considering they reached that in FY20.
Why is it a good business?
Similar to many other large retailers, Tractor Supply benefits from scale advantages and its brand. A national presence means the company can be more efficient when negotiating with vendors, builders and advertisers. National advertising (as mentioned in our write-up on Five Below) is much more efficient that localized advertising. Furthermore, expertise in digital marketing, which can be done with a larger advertising budget, tends to produce better results than just traditional advertising alone.
Interestingly, Tractor Supply may not scale as well as other national retailers because the company customizes its product offerings by region more than the average retailer. The company estimates that 15%-20% of a store has an assortment of products that are unique to the region. Tractor Supply has mentioned that customers that buy feed for livestock tend to look for the local brand.
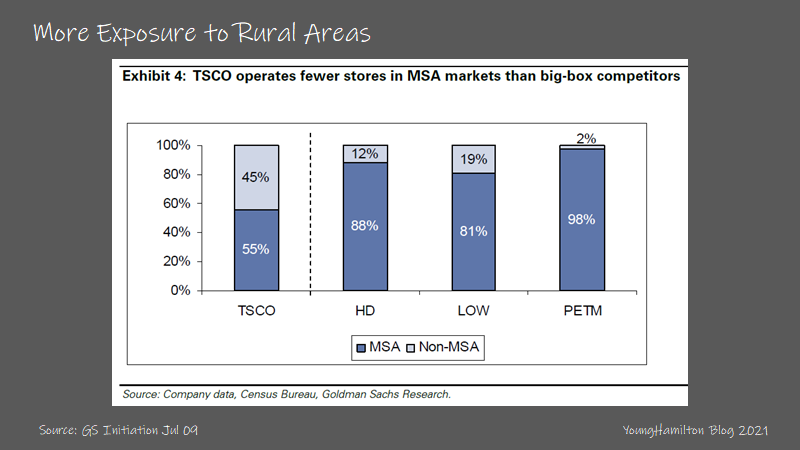
Having more exposure to rural and semi-rural neighborhoods in the U.S. tends to be a competitive advantage as well. As we’ve analyzed in our write-ups for American Tower and Dollar General, these areas have less competition and customers don’t have as much choice. For example, Tractor Supply doesn’t have to compete much with Home Depot or Lowe’s (for the product offerings that overlap) because these two companies operate more in urban/suburban environments.
The market for specialty products targeting the rural customer has many tailwinds (accelerated by the pandemic) and Tractor Supply should benefit nicely. First is the shift from urban to suburban/rural housing. Customers that adopt the rural lifestyle are likely to find that Tractor Supply meets their needs for most of their everyday goods. The pandemic has also caused a pet boom. Tractor Supply estimates that 75% of their customers own pets and 25% of them acquired another pet during FY20. Pet supplies and food are a large portion of Tractor Supply’s revenues and these are recurring purchases. Third, the smaller competition got much weaker during the pandemic, which also helps solidify Tractor Supply’s leading position.
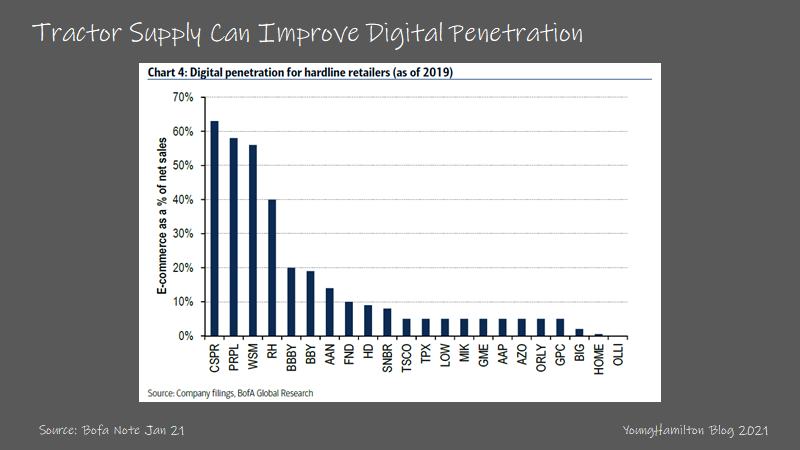
Similar to home improvement, online penetration of many of the goods that are sold at a Tractor Supply store are low. This is likely because the value/weight ratio of many of the goods are not very high. Furthermore, the customer is still in the middle of adopting eCommerce and mobile shopping for everyday purchases. Tractor Supply is meeting these needs by offering an omnichannel eCommerce solution by leveraging its existing network of stores.
Returns on incremental capital?
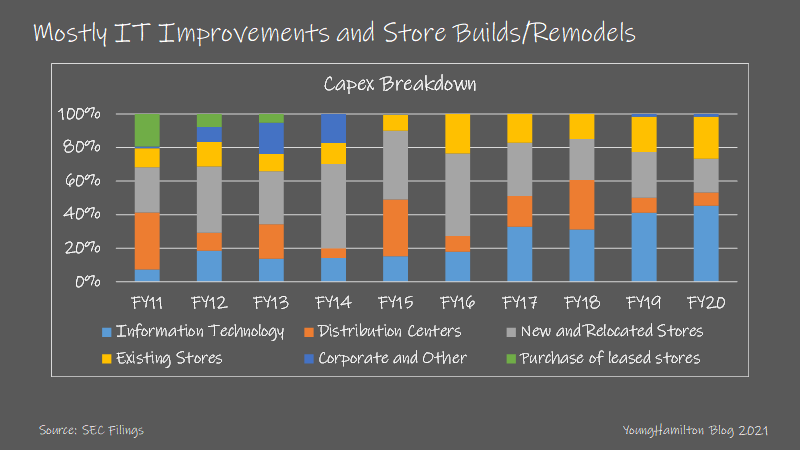
Over the past 10 years, Tractor Supply has spent 95% of its capital on capex with the remainder on the Petsense acquisition in 2016. If you breakdown capex, most of the capital in recent years has been spent on building out the company’s IT infrastructure, which includes an improved POS system, eCommerce platform, merchandising and inventory management tools, pricing optimization and a loyalty program. Management has indicated that IT spending should decrease going forward as the bulk of these investments are now behind the company. Other large areas of capex spend include new store buildouts and remodeling existing stores.
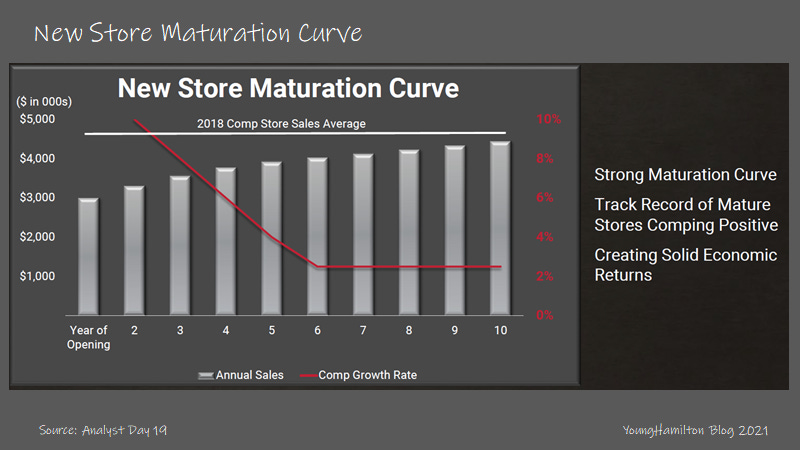
The math for new store builds is $900k for build and start-up costs, which leads to first year sales of roughly $3.1M. New stores take many years (up to 10 years) to mature to the average store level, which is another reason why sales/sq ft should improve materially once the new store builds become a smaller part of total revenue growth. Assuming that new stores produce lower EBITDA margins than the company average (let’s say 9%), the returns are $279k / $900k = 31%. It’s possible that store level EBITDA margins for new stores could be even lower given the scale and time to ramp, so at 7% the returns are 24%. We also have to keep in mind that sales increase meaningfully (and EBITDA margins) over 10 years to the company average which was 4.5M in FY19 and 5.5M in FY20.
The returns on retrofits of other retail concepts are lower because they cost $1.5M on average. Assuming similar revenue and EBITDA margins, the returns come out much lower at 14%-19%. Retrofits are likely larger locations than the company average, which could skew the numbers a little higher on revenues and EBITDA, which would make the return calculations a little better.
The Side Lot investments are interesting because the company is attempting to make its outdoor retail space much more productive. Previously, the outdoor lot was used for storage of bulky items that were sold at a lower velocity such as fencing, gates and housing for animals. The lots were often a mess compared to the inside of the store and not always easy to access. Tractor Supply plans to build a 4k-5k sq ft lawn and garden section in the outdoor space.
For Petsense the company has stated that the return numbers for new store builds look similar to that of Tractor Supply, though that may have changed over the past year. The cost to open a new Petsense store is much lower at $200k-$400k and the revenue tops out around $1M. Assuming a similar margin profile to that of Tractor Supply, the return numbers actually to get pretty close to that of new Tractor Supply stores.
It would be difficult (and likely not meaningful) to estimate the returns on the IT investments, but the eCommerce investments are likely well worth the dollars, considering it captures incremental customers who have access to a larger assortment of products. eCommerce penetration has ticked up nicely since launch and currently makes up 6% of total company sales, up from 3% in 2019. Roughly 75%-80% of online orders are picked up in store and this less costly for Tractor Supply since the company doesn’t need to fulfill the last mile delivery. The company has found that 20% of these orders result in incremental sales when customers come into the store to pick up their items.
We estimate that the company has achieved returns on incremental capital between 25%-30% over the last 5 years not including FY20 (return numbers shot up materially). The volatility of returns is larger for Tractor Supply than other retail businesses we’ve analyzed because of its exposure to energy + ag markets. The company estimates that 10% of its stores are located in markets that have a high concentration of energy related businesses.
Reinvestment potential?
Tractor Supply estimates that its addressable market is $110B, which implies the company commands ~10% market share. There are still many more market share gain opportunities if you consider the stores left to be built and the instore / online efficiency gains coming down the pike. Petsense could also add to this opportunity but it seems like the overall opportunity there is much smaller than the company anticipated when it acquired Petsense in 2016.
From a store unit perspective, Tractor Supply used to have a 2,100 store target until the 2015 when it was moved higher to 2,500. Tractor Supply has ~650 stores remaining to build out according to the company’s last round of analysis which was done in 2019. Most of the opportunity still lies within the west and mountain regions where the company doesn’t have as large of a presence. At 80 new stores per year, Tractor Supply should reach its target in ~8 years.
For its key initiatives, Side Lot and Fusion are big uses of capex. The company expects to continue to invest in store improvements for the next 5 years. For FY21, both Fusion and Side Lot projects are slated for 150-200 stores and if executed correctly, they should result in a lift in sales/sq ft.
With returns on incremental capital of 25%-30% and a reinvestment rate between 35%-40%, we estimate that Tractor Supply has increased its value between 10%-12% annually over the past 5 years not including FY20. Returns for Tractor Supply will fluctuate more than other retailers but this should flatten out as the company’s exposure to non-energy markets comes down over time and as the company focuses more on efficiency gains.
What else is important?
Acquisition track record
Tractor Supply’s recent acquisition track record isn’t great but the capital spent on these deals have been relatively small. In 2005, the company acquired Del’s Farm Supply, which was a farm retail chain that had 16 stores across in the Pacific Northwest and Hawaii and a distribution center. The company was acquired for $19M including assumption of certain working capital liabilities. The stores generated $34M in revenue, so the deal was for 0.55x trailing revenues. Fast forward to 2009 and Tractor Supply expanded the Del’s Farm Supply concept to 28 stores. However, in subsequent years most of Del’s Farm Supply stores have been converted to Tractor Supply.
The next acquisition was Petsense in 2016. Tractor Supply had figured out that there was a section of the rural pet market that it wasn’t servicing, so it acquired Petsense for $145M, or $116M net of tax benefits. The company had 136 stores and generated ~$100M in revenues, or $735k per store. The implied deal multiple was for 0.86x trailing revenues.
Tractor Supply has stated that the 4-wall ROI for Petsense was similar to Tractor Supply stores and that the stores could do $1M in revenues at maturity. At the time of acquisition, Tractor Supply envisioned Petsense to have a 1,000 store opportunity but that number is likely lower now as growth of new stores has slowed in recent years. Tractor Supply took impairment charges on the Petsense acquisition for $60.8M related to goodwill, $8.2M in trade name asset and $5.1M for underperforming stores.
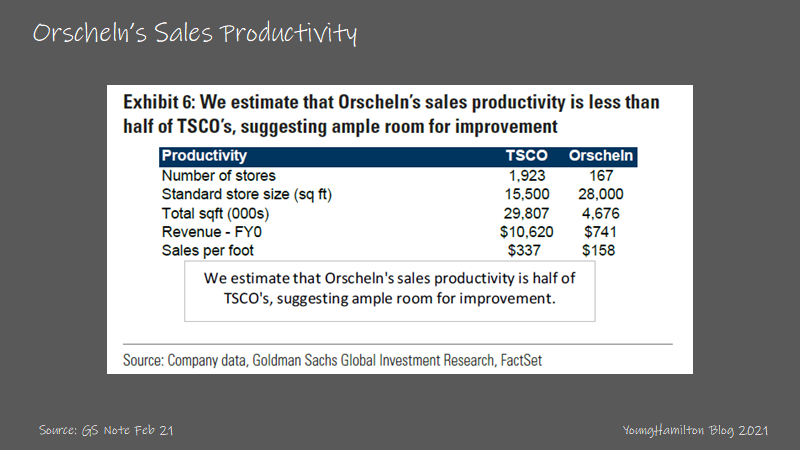
Tractor Supply’s latest acquisition is Orscheln (announced in February 2021), one of the larger competitors in the rural retail category. The two companies have a similar façade and color scheme. The typical Orscheln store is larger at 28k sq ft and the stores are not as productive as Tractor Supply stores.
The company was acquired for $297M net of future tax benefits. Orscheln has 167 stores across 11 states and this implies that Tractor Supply paid $1.78M per store (as compared to the new store cost of $900k). While the financials for Orscheln weren’t disclosed, some estimates put revenues in the $650M-$750M range, which would imply a deal multiple of 0.42x at the midpoint. There is an opportunity to improve the margin and growth profiles of these stores by applying the expertise from Tractor Supply, which could make the deal terms seem better down the line.
In the case of both Del’s and Petsense, the company likely envisioned growing the brands as stand alone concepts but failed to meet the projected growth rates at the time of acquisition. It’ll be interesting to see what happens with Orscheln but if it’s anything like the other two deals, we shouldn’t expect meaningful returns on capital for this deal.
Covid impact
Tractor Supply was a beneficiary from the pandemic and related lockdowns. Comp store sales growth numbers in FY20 were the best in the company’s recent history at +23%, +11% of which came from increased trips the store and +12% of which came from increases in basket size. This compares to an average of +4.1% for the 9 years prior.
The company also gained 11M new customers in FY20 and reactivated another 6M customers that hadn’t shopped with them in years. These new customers also returned to the store more often. 20% of the new customers came back for another shopping trip in a month and 50% made it back within a year. The trends continue into 2021. The company has gained 2.5M new customers in 1Q and more in 2Q.
Tractor Supply suspended buybacks and took on $650M in senior notes to insulate itself from a recession, but that likely wasn’t necessary considering the company’s performance in FY20.
Optionality
Tractor Supply is already on its path for the next phase of its life cycle. The company should be able to make up for slowing unit growth by increasing efficiency at its existing locations. With the M&A that Tractor Supply has done so far, it’s likely that the company wants to acquire and grow a separate retail concept to add to their growth profile. While the past transactions haven’t worked out the way the company had hoped, it’s good that the company takes these types of chances.
The other option is to move into new geographies like Canada and Mexico.
If you made it this far, I hope you received some value from reading our analysis. Please subscribe to the free newsletter and share with anyone that would find it valuable. Thank you for your support!


Really enjoyed this write-up I just had a quick question about how you calculate “net capital deployed” in your ROIC calculation. I’m sure it is different for every company, but what are some general rules for finding that figure?
Five Below and TS may be the winner takes all on th elong rund , this analyssys show brilliantly why