Subscribe to AGB - One analysis of a good business every two weeks.
Dollar General
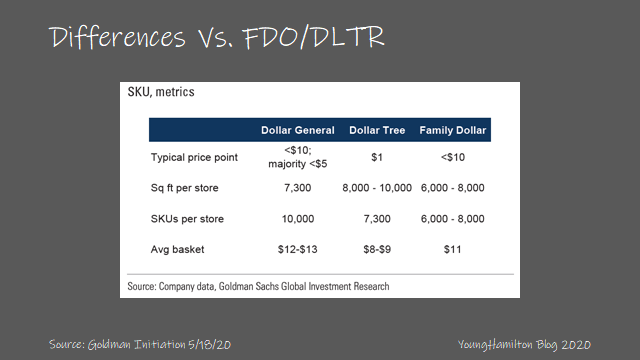
Dollar General is largest “dollar” retailer in the U.S. with over 16,000 stores. Though the name would suggest otherwise, Dollar General sells merchandise up to $10 in price in categories such as consumables, household products, apparel and seasonal non-consumable items. Because value is important for Dollar General’s customers, 75% of items offered in store are below $5 in price. Average basket sizes at checkout have historically been in the range of $10-$11 but have increased to $12 since Covid.
It may be helpful to compare Dollar General to its largest competitor in the “dollar” space, Dollar Tree. While there may be lots of overlap in the core customer, Dollar Tree offers most items close to the $1 price point and has a much higher non-consumable mix at 50% vs 75% for Dollar General. Consumables generally have lower gross margins than non-consumables. Dollar Tree leans more urban while Dollar General has more of its stores in rural areas. Dollar General actually compares better to Family Dollar, which was acquired by Dollar Tree in 2015. And we’ll make specific comparisons with Family Dollar later on.
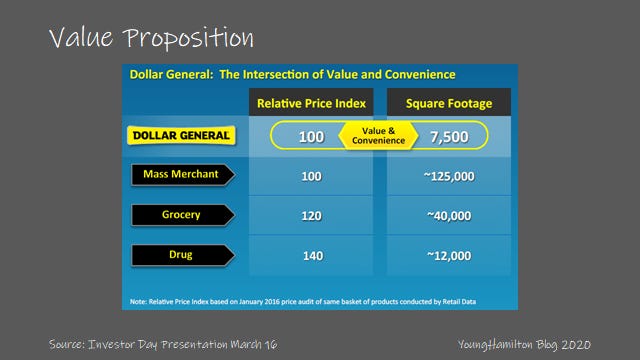
The value proposition of a Dollar General store is convenience at very attractive price points. Prices are comparable to mass merchant retailers like Wal-Mart, yet the average store size is one of the smallest in retail at 7,500 sq. ft. Prices are 20% lower than the Grocery category and 40% lower than Drug stores.
Customers that shop at Dollar General tend to have small basket sizes as they make frequent trips in between their larger weekly purchases at either mass merchant or grocery retailers. The proximity and convenience of shopping at a Dollar General store allows for the frequent trips and the value pricing fosters a loyal customer base. Over 75% of U.S. households live less than 5 miles from a Dollar General store. And as mentioned before, Dollar General stores are mostly located in rural regions where the closest grocery store could be 20-30 miles away.
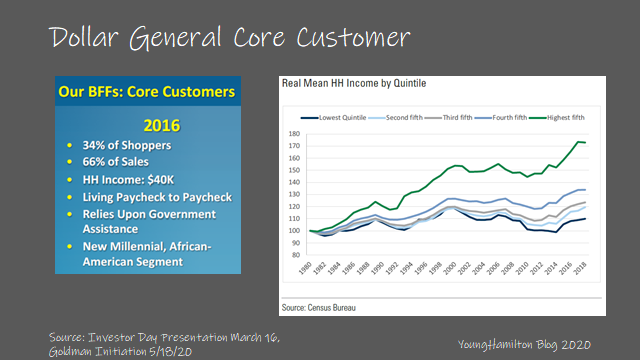
To understand the value proposition of Dollar General, it’s helpful to understand the core customer. The core Dollar General customer supports a household with annual income between $40k-$55k. They are behind the curve in many of the consumer trends such as health conscious foods, smartphone adoption, digital coupons, etc. They typically rely on government assistance such as the Supplemental Nutrition Assistance Program (SNAP). Income for these customers have not increased much since the great recession and an economic downturn has a higher impact on their purchasing power.
Dollar General and other retailers in the “dollar” category typically are recession resistant due to the trade down effect from consumers. As people lose employment, they tend to tighten their budgets and look for value in everyday goods. During the last recession of ‘08-‘09, Dollar General had positive same store sales and gained market share over the other retail categories.
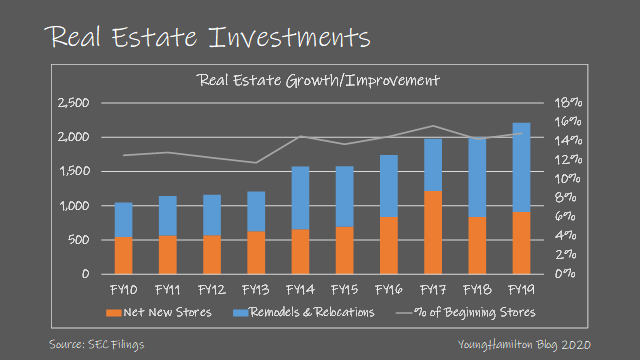
Dollar General has taken this model of value + convenience and coupled that with superior execution and process to grow rapidly. The company has almost doubled the number of its stores over the past 10 years, opening 800-1000 stores annually. The company also improves and/or relocates many of its older stores to keep the store formats up to date. It has over 17 distribution centers around the U.S., and continues to build more to lower the average miles from a distribution center to a store.
Why is it a good business?
Dollar General’s two competitive advantages are Process Power and to a lesser extent, Scale Economies. The process of continuous improvement is ingrained in the Dollar General culture. The company periodically improves its store layouts, distribution process, inventory management and digital strategy, all while increasing its store base by an average rate of 6% annually.
While process power can be somewhat elusive to think about, to fully appreciate the advantage at Dollar General, we must compare the business to its closest competitor, Family Dollar. Family Dollar has a very similar mix of product offerings compared to Dollar General. Almost 3/4 of its products offered in store are consumables and they target a similar core customer. The store sizes are similar at 7,500 sq. ft. and most items are priced between $1 and $10. Its locations are a bit more skewed towards denser population centers, but the majority of its stores are in rural areas, similar to Dollar General.
After interactions with activist investors (Nelson Peltz in 2011 and Carl Icahn in 2014) Family Dollar was sold to Dollar Tree in 2015. Because Family Dollar was officially in play, Dollar General offered to acquire Family Dollar for a higher price in the form of a cash offer. Family Dollar rejected Dollar General’s proposal citing potential difficulties to get regulatory approval.
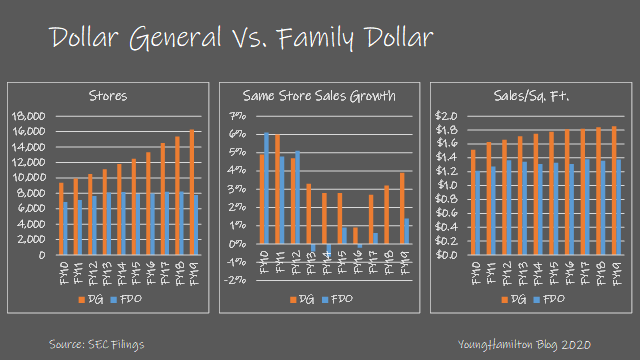
Since Family Dollar was acquired by Dollar Tree, Dollar General has outperformed by most metrics. Growth in the number of Family Dollar stores has stalled and same store sales have been stagnant. The same store sales differential since the deal was announced has averaged 2.2% annually (FY14-FY19). Furthermore, the sales/sq. ft. between the two companies has continued to widen. It’s worth mentioning that Family Dollar was required to sell 330 stores to Sycamore Partners to form Dollar Express to close on the acquisition by Dollar Tree. Dollar General later acquired the Dollar Express stores and converted them over to Dollar General stores in 2017.
Dollar General has instituted three initiates in recent years that should shore up margins while also increase sales. The most important is DG Fresh. Dollar General has been increasing the cooler count in its stores to sell frozen and perishable foods. Because that effort has grown large enough, the company elected to manage its own distribution of perishable goods. This initiative increases margins as it takes out a middle man, but it also helps with sales because stock-outs are much less frequent. The company has mentioned that the difference in stock-outs of dry goods vs. perishables has historically been ~10%. Dollar General also has the opportunity to push more of its private label brands (also higher margin) with control over its distribution.
The Non-Consumable Initiative is also compelling. The company as actively invested to offer more seasonal and home/domestic goods while focusing less on apparel. This shift has resulted in improved traffic (due to the higher frequency of changes in display goods), which leads to higher sales. The company also benefits from product mix as non-consumables have higher margin profiles vs. consumables. Every 1% increase in mix of non-consumables leads to a 0.15% increase in margins.
Fast Track is another initiative that should help with margins and overall efficiency. Optimization of goods starting at the distribution centers allows for a better shelf stocking process at the stores. The increased productivity results in better in-stocks. The company is also implementing changes in the way customers check out with its self-checkout app, DG Go! Customers can scan items themselves without the help from a cashier, which frees up more labor to do shelving and restocking.
Returns on capital?
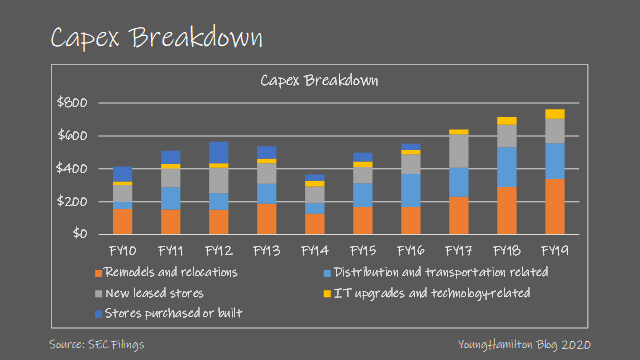
Dollar General spends almost $800M on capex annually, most of which is spent on building new stores, remodels or relocations of existing stores or expanding distribution capabilities. Over the past 10 years, 35% of capex has been spent on remodels and relocations, an indication that the company continuously looks to improve the customer experience. New stores make up 32% of total capex, which is the highest returning use of capex (we’ll go over this in detail shortly). Distribution and transportation has become a larger part of capex over the past 5 years as the company has increased density across its many MSAs. Any improvement in efficiency in the supply chain leads to better margins (lower incremental costs) and increased sales (lower stock outs). And lastly, 6% of capex has been dedicated to IT and technology upgrades.
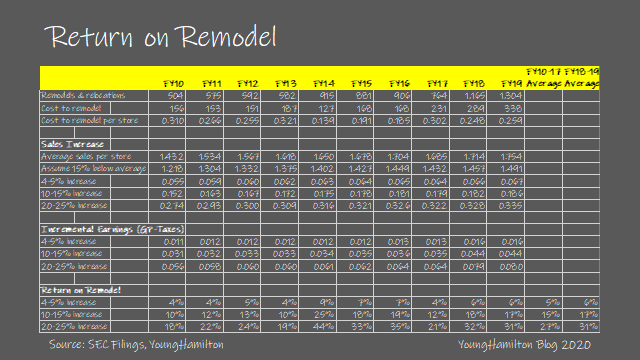
While there isn’t perfect publicly available data for remodels/relocations and new store buildouts, we can estimate the returns for both of these uses of capital over the past 10 years. We caveat the analysis by noting that the cost varies across geographies and the size and scope of each real estate improvement activity, but on average the cost to remodel/relocate a store has ranged from $200k to $300k. We can assume that a relocation is much more expensive but let’s go with averages for now. We know from company disclosures that a typical remodel increases same store sales by 4%-5%, whereas a remodel with cooler expansions increases SSS by 10%-15% (15% if produce is introduced). And a relocation adds a 20%-25% increase in SSS.
Assuming that incremental earnings for a store remodel are the gross profit dollars – taxes, we can estimate what the returns of the remodel capex would be for each of the different scenarios, assuming that the cost to remodel/relocate was the average. We assumed that only an underperforming store would be remodeled or relocated and we adjusted the sales for this store down by 15% from the average. The analysis is imprecise, but it’s helpful to see the range of outcomes to be between 5%-27% prior to the Tax Cuts and Jobs Act of 2017 and 6%-31% post the tax cut. On average, we estimate that a remodel/relocation averages to 18%-23% returns on capital prior to the tax cut and 22%-27% after the tax cut.
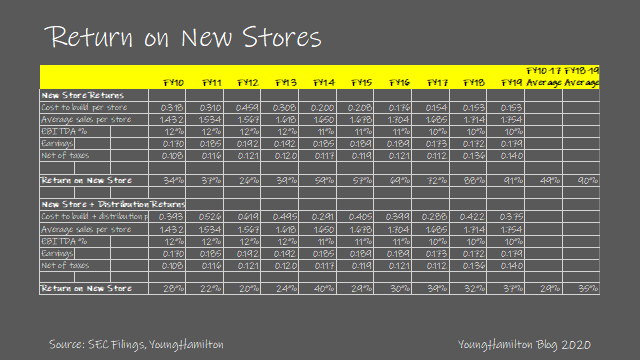
We can also estimate the return for new store builds. The cost to build a store is on average $250k, but the range has been $150k to $300k. If we assume that a new store gets to the average sales per store eventually, we can estimate normalized earnings. Assuming that store level cash earnings are EBITDA – taxes, we can estimate the returns on a new store build out to be 49% prior to the tax cut and 90% after. But of course this likely too high because new stores require more distribution.
The more insightful analysis would be add distribution and transportation investment to new store capex. For every 1,200 stores, Dollar General typically opens a new distribution center. Adding the distribution and transportation capex results in the average cost per store to be between $300k and $600k over the past 10 years. Making the same assumptions for store level cash earnings, a store that reaches the average sales/store will return on 29% on capital invested prior to the tax cut and 35% after.
The company has stated that average 1-year new store IRRs are between 20%-22% after the tax cut in 2017 with the payback period being 1.7 years. So why is the stated new store IRR lower than our estimate of 35%? It’s mainly because the stores take time to ramp up and we assumed that the new stores reach the company average sales/store. We have to remember that not all locations have the potential to reach average, especially the smaller box urban formats. Furthermore, there is cannibalization that occurs when adding a new store within a certain geography. And we’d like to point out that our assumption that the store level cash earnings of EBITDA – taxes doesn’t take interest expense into consideration, which is roughly 0.5% of revenues.
We estimate that the company has generated between 28% and 32% annual returns on total capex spent over the past 6 years. This includes the remodels, which have lower returns than the new stores, and the capex spent on distribution/transportation as well as the IT related investments.
Reinvestment potential?
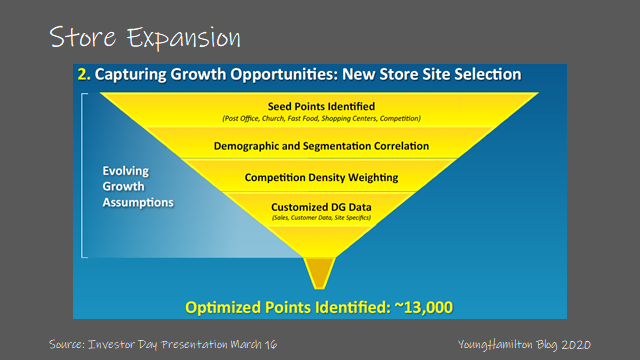
The reinvestment opportunity is the biggest question for Dollar General because the company already has over 16,000 locations. The company stays busy, undertaking remodels/relocations and opening new stores to the amount of 15% of its existing store base annually. In FY20, the company expects to remodel/relocate 1,600 stores and open almost 1,000 new stores. At the company’s 2016 Investor Day, Dollar General made the case for 13,000 incremental new store locations that have been identified by the company. That number has more or less stayed the same four years later, which implies that Dollar General has expanded its view of its opportunity set.
Looking at a map of existing Dollar General stores, it’s easy to see that expansion opportunities exist in the Western U.S. However, just because there is more white space, it doesn’t mean it’s easier to open up locations. We have to consider supply chain, weather, income demographics, etc. and of course, store level ROIC.
Goldman did a nice estimate of the “dollar” store opportunity that remains in the U.S. in an initiation report from May 2020. They segmented the top 900 MSAs by the number of total number of “dollar” stores per Wal-mart location, number of households, and existing market shares. Goldman estimates that the incremental opportunity is much smaller than management has stated at just 7,500 incremental locations.
Dollar General surely recognizes that high returning locations in rural America has limited runway, so the company has been steadily expanding its opportunity set, implying lower returns and margins. For example, the company is experimenting with the DGX format, which is a smaller store that serves urban customers. Dollar General has also introduced a new retail concept called popshelf, which is a larger store format at 9,000 sq. ft. and targets customers with annual household incomes between $50k and $125k. The company is initially offering mainly non-consumables such as seasonal items, home décor, health and beauty, and cleaning supplies. Price points will most likely be near the $5 range. This new concept mostly competes with Five Below, another retailer with industry high returns on capital.
Dollar General has the opportunity to increase its share outside of the “dollar” channel, which makes up ~5% of the household spend in the U.S. While Dollar General leads in wallet share of the “dollar” channel, the company is looking to move up market because of its value proposition vs. grocery, drug stores and convenience vs. mass-merchants. The company has been on this path for quite some time. With the cooler expansion initiative and deciding to sell produce in many more of its stores, Dollar General has already started to gain share from the grocery channel.
Even with the company’s impressive annual new store expansions and remodels/relocations, the company’s reinvestment rate is on the low-end of the companies we’ve analyzed on AGB thus far (similar to Starbucks). We estimate that Dollar General reinvests 30% of its capital annually. The remaining capital in the range of 50%-70% has been spent on share repurchases and dividends, which have generated a good return for the company for the past 10 years. With a 30% reinvestment rate, we estimate that intrinsic value compounds at 9%-11%, annually. We have to keep in mind that this doesn’t take any share repurchases into consideration and we’d point out that the consistency of returns year after year is pretty remarkable.
What else is important?
What happens in a recession/Covid implications
Dollar General wasn’t a public company during the last recession. The company was taken private by KKR in 2007. However, we do know that the company continued to open new stores from 2008 to 2011 (after a small contraction in 2007). The company’s stock price tends to outperform in recessionary environments due to the trade down effect by consumers.
This was the case in the recent Covid related shutdowns. While Covid was unique in that people stock piled household goods and many restaurants were forced to be closed, the company did also experience a boost in sales from the trade down effect.
Something to keep an eye on is the same store sales growth trends in recent months. Since the mandatory lockdowns in March, Dollar General experienced a strong initial uptick in sales with +34% SSS growth in March but that has trickled lower in the following months to just +15% in August. We have to remember that the core customer comes from a lower income household and had most likely been assisted from the stimulus package and increased unemployment benefits from the Cares Act. Dollar General may have a hard time comping against those same store sales number next year, depending on where the U.S. is on its path to recovery.
Margins down even with process improvements
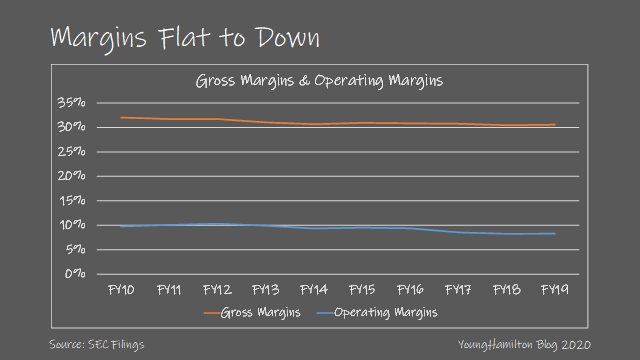
With increasing scale and many process initiatives that should result in improved margins, it’s interesting to see that gross and operating margins have come down by 1.5% over the past 10 years (total, not annually). This is one of the reasons that we say that scale doesn’t really impact the business as much as it should. Scale helps with being able to have more negotiating power when sourcing inventory and leveraging IT and distribution capital spend but most of the cost structure of the company is at the store level, meaning SG&A leverage can only go so far.
The tradeoff that Dollar General is making is growth at the expense of margins. We know that the higher margin locations are in rural areas and the higher margin dollars are in the non-consumables items. However, Dollar General has expanded into larger MSAs over time, even opening stores in urban areas. And the company has continued to grow the consumables business, selling a higher mix of lower-margin frozen and packaged foods and now even selling produce. The benefit is the uptick in same store sales but it comes with margin pressure. A remodel with more cooler doors and adding produce leads to a 15% uptick in same store sales.
So we can see that the process improvements, more efficient supply chain management, and taking control of the distribution of perishables with DG Fresh all help mitigate some of the margin pressure from this type of growth. We do have to consider that as the company continues to grow and expand what it considers to be potential identified store locations, we could see further margin pressure.
Optionality
Move up market
The company is already moving upmarket. As we mentioned earlier, Dollar General announced its popshelf store concept that will focus on non-consumable goods near the $5 price point. The store will be in denser MSAs and target higher income households. Dollar General is trying to take its expertise in selling to the lower income core customer and shifting upmarket to capture incremental wallet share. While the concept is so new, this could lead to an expansion of its identified store locations.
International expansion
Another logical growth vector would be in foreign markets. Canada is a natural growth opportunity for Dollar General but the competitive dynamic will be different. It may also be the case that Dollar General will have a more difficult time securing attractive rural locations in Canada, due to the population density around big cities vs. rural towns.
If you made it this far, I hope you received some value from reading our analysis. Please subscribe to the free newsletter (if you haven’t already) and share with anyone that would find it valuable. Thank you for your support!



Thanks for the writeup! Two questions. 1) DG's flywheel effect that you mention seems to me like a process that a typical business does (increase share -> leverage economies of scale -> reinvest back into the business). Am I thinking about this the wrong way? 2) re: margin pressure from the product mix, do you have an idea of what the margin would look like without owning distribution? I imagine over time the margins of a DG store will begin to more similar to a WMT super-centre